STEP-1
Buy if stock is above 50SMA (so it is up trend) if 3-5 bars are above 50SMA then it is over all uptrend, so instead of 1 bar wait for 3 bar.
Short if stock is below 50SMA below 50 SMA means down trend. If 3-5 bars are below 50SMA then it is over all trend is down, so instead of 1 bar wait for 3 bar.
STEP-2
if candle stick is in 50SMA if top 25% of candle stick is above 50SMA buy, same way if bottom 25% is above 50SMA short.


KJTRADINGSYSTEMS.COM

The Path To Consistency Starts With This Tool! With Steve Primo
BUY SET UP
Green bar closes BELOW previous green bars low.

Momentum/trend is up so 2nd green bar shows green filled color. Normally green filled bar is red per western standard.
SELL SET UP.
Red bar closes ABOVE previous red bar's high.

Momentum/trend is down so red fill and red outline.


Learn to Trade Big Pullbacks with the RSI2 Strategy 01/09/20

CLOSE means price 20-120, MA below 2000 volume 500000
 .
.
Strategy -1 Buy and Short many stocks at market close.
Strategy 2 - Divergence
Strategy 3 - Pull back.. in nice perfect trending stocks RSI reaches 2 that is point for pull back end. There make sure green bar goes above red bar otherwise don't trade (no pull back end)
How to Trade Momentum: RSI Power Zones Setups in Today's Markets 01/12/20
RSI Bear zone -
Support zone 20-30
Resistance zone - 55-65
RSI Bull zone -
Support zone 40-50
Resistance zone - 80-90


Backtested entries video, trade a naked chart, and breakouts (Three Fantastic Algo Trading Entries That Work in 2020) - 1/31/20
Mistake 1 -
Most traders focus only on entries
Bad bad BAD
You need to take entry and then properly develop strategy
Mistake #2
Most traders never test entries.
Mistake #3
Most people test strategies incorrectly
9 TERRIFIC TRADING ENTRIES
ENTRY AND EXIT CONFESSIONS OF CHAMPION TRADER-
both are KELVIN J DAVEY books

ENTRY#1: (confession book entry 38)
simple. daily bars(candles)
Tested over limited period.
if it gives profit over most iterations may be it is good strategy and worth further investigation.
ENTRY #2(free book entry 4)
daily GOLD bars
Initial test over 2 yrs.
if itt gives profit over most iterations may be it is good strategy
ENTRY #3 (free book entry 3)
SIMPLE
240min bars mini S&P
Initial test over 2 yrs.
if it gives profit over most iterations may be it is good strategy


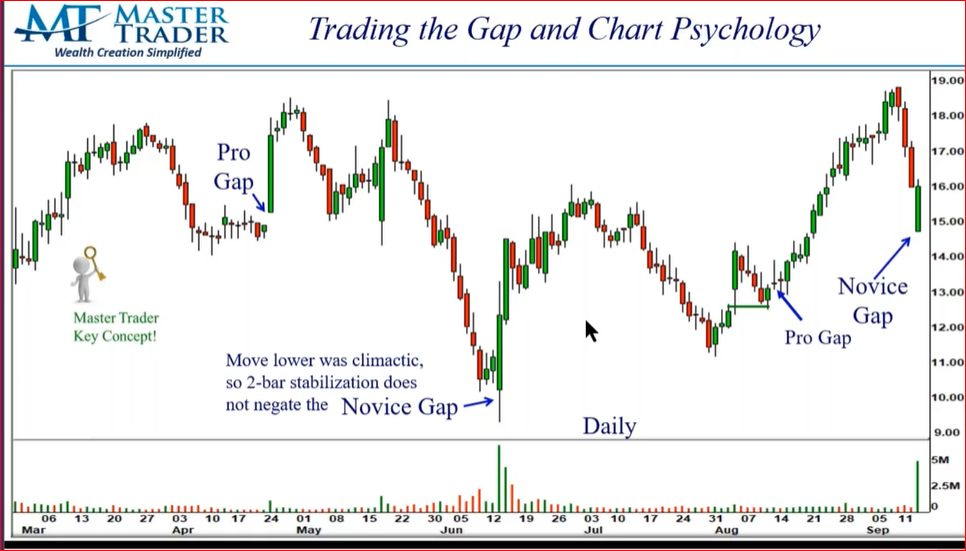
How to Create a Morning Gap Trading Plan with Chart Psychology 01/25/20
BOF - break out failure
TT - Top Trailing


Getting into New Trends Early by Trading Bowtie Patterns and First Thrusts 02/18/20
if Price shoots up from multi year low or all time low then pull backs 2 or 3 ticks then raise again. Buy in pull back.
** Major low or at least lower high
BOW-TIE RULES
1. After a Major low the moving average must go from downward proper order 10SMA < 20 EMA < 30 EMA. To uptrend proper order 10SMA > 20 EMA > 30 EMA over a short period of time, ideally 3-4 days of period.
2. Stock (or other market) must have (at-least) a 1-bar pull back
3. Go long above (2).


Pay careful attention to Weekly signals.
Discover the Exact Four Strategies for Making Consistent Investment Income - FEB 15, 2020


$0.30 GE 20Sep019 $10.00 Call Sell-to-open
Instant dividend 30.00 per option contract sold.
if GE closes above $10 on september 20...
$4.80 GE 15Jan21 $5 Call Buy-to-open (we execute)
$5.00 GE 15Jan21 $5 Call called out. (we have to sell)
--------
$0.20 Break even
$0.30 GE 20Sep019 $10.00 Call Sell-to-open
$0.50 Total Profit


Below Pic - Price goes down but momentum goes up

Find lowest intraday low in 60 bars (3 months) it is A. B is corresponding momentum. Find lowest momentum point is 60 bars that is point C. corresponding price is point D. Then find highest momentum point between point B & C inclusive of these 2 points., that is E. draw horizontal line from E. when ever momentum moves higher than line, mark that is a ENTRY point alas Trigger point.


PROFIT /TARGET
Target 1 - 50% range D-A
Target 2- 100% 50% range D-A
Target 3- 200% 50% range D-A
or 2% futures, 5% stock 3MA rule.
,
setup used Momentum. MACD, CCIalso used
Learn How to Anticipate Market Movements with Fibonacci 02/23/202
Fibonacci Analysis


Step -4


