திங்கள், 28 ஜூன், 2021
BUTTER FLY
வியாழன், 3 டிசம்பர், 2020
Option idea or strategy from others
Let’s assume the stock falls 7% over the next 12 days leading up to the option’s expiration date. First of all, this is a pretty big move. It is unlikely, but we will use it for this example. A 7% decline in Tesla stock would put shares at $206. And since this is below the 222.5 put we sold, we would be forced to buy the stock. Our new cost basis would be $211.50 ($222.50 purchase price minus $11 option premium). Although the stock has fallen a full 7% in value, we are only down 2.6% because of the money we received for selling the put option.
At this point, we can simply reverse our strategy – selling a call option in order to get paid for selling the shares. We will again be selling an out-of-the money option, thus demanding a price higher than it trades today. We own the stock for $211.50. It now trades for $206 Looking out another 2-3 weeks, we can sell the $210 call option for $8.00 per share. This immediately puts another $800 into our account and lowers our cost basis again to $203.50
($222.50 - $11 put option - $8 call option)
Sellers are able to make consistent profits. Buyers almost always lose over the long-term. This strategy is not without risk, however It is far safer than most approaches and even carries less risk than simply buying stock outright – but it is not foolproof.
If a stock falls dramatically, losses can still be had. For that reason, I recommend only selling puts against stocks you are ready and willing to own.
Everyone buying = Increased IV
● Market makers receive more $ for selling
● Traders over pay for options
Everyone selling = Decreased IV
● Market makers spend less when buying
● Traders receive less premium than they
When implied volatility is high because everyone is buying –so sell options. Use the implied volatility manipulation to your advantage.
() If you insist on selling naked puts against riskier equities, do so in smaller amounts. My personal allocation per trade is as follows:
Large Cap Blue Chips (Home Depot, Wal-Mart, Berkshire Hathaway) ● Up to 10% per trade
2nd Tier Stocks (First Solar, Netflix, 3D Systems) ● Up to 5% per trade
Speculative Trades (turnarounds, small caps, new IPO’s) ● Up to 3% per trade; 10% of portfolio or less.
My new found strategy.
CALL Buy
Look Haikin-Aschi candle. Consider this after Minimum 5 red candle. Day by day it became small and small. look wicks and candle size. When current Lower wick is higher, than previous lower wick that means Current candle body and wick should be smaller than previous candle and wick, look HMA (10,20) EMA (3,8) it has to turn then buy at strike on .4 delta with 90 or 150 day expiration. Chances are high for it to get higher in few days. Choose sector leading stocks for max profit.
SELL - if you get 40% profit. Spread (width 1 risk 1 reward, not 10 or 20) is good. Buy 2 get profit 60/80% min second.
PUT sell
Look Haikin-Aschi candle. Consider this after Minimum 5 green candle. Day by day it became small and small. look wicks and candle size. When current candle higher wick & close is lower than previous candle higher wick and close (Current candle body should be smaller than previous candle.), look HMA (10,20) EMA (3,8) it has to turn then buy at strike on .4 delta with 90 or 150 day expiration. Chances are high for it to get lower in few days. Choose sector leading stocks for max profit.
SELL - if you get 40% profit. Spread (width 1 risk 1 reward, not 10 or 20) is good. Buy 2 get profit 60/80% min second.
Hit and Run
ITM around .7 delta , make sure volume is low when buying , lot of open interest mt 1000, tight ask-bid spread less than 7% is ok 5% is good 2% is perfect, if it does not move within a week close or reevaluate position to eliminate loss!, always look for the tightest bid / ask spread to minimize slippage.
If Earnings are 2 weeks away don’t buy/enter. Don’t buy immediately after earnings, allow 3-4 days or 2 weeks to settle.
** 3 by 8 Trap **
Buy an option or stock if it is in 3×8 trap green candle , do not buy if it is red candle. If price is above 3x8 trap, wait it will come down to 3x8 trap. Draw trend line if price comes down to trend line and if it is in 3x8 trap enter trade.
சனி, 2 மே, 2020
Option Strategies like big banks and institutions
Implied volatility is artificially skewed by market makers on a regular basis, especially on out-of the-money options.
only one variable is manually set by market makers is volatility. They cannot change other greeks.
In these one-sided markets, option traders are actually dealing directly with market makers instead of another option trader. This is why implied volatility tends to rise in a bear market and drop in a bull market. In a bear market, traders usually rush into put options all at once. In a bull market, the buying of call options tends to be more spread out and less "hurried". Is it making sense?
Everyone buying = Increased IV
● Market makers receive more $ for selling
● Traders over pay for options
Everyone selling = Decreased IV
● Market makers spend less when buying
● Traders receive less premium than they
● 100 shares of TSLA: $22,200
● 50% margin requirement: $11,100
● Option premium received: $1,100
● Gain on successful trade: 10% in 12 days
Now I know what you’re thinking. “Yeah…but what if the stock falls below $222?” Let’s explore that. Let’s assume the stock falls 7% over the next 12 days leading up to the option’s expiration date.
First of all, this is a pretty big move. It is unlikely, but we will use it for this example. A 7% decline in Tesla stock would put shares at $206. And since this is below the 222.5 put we sold, we would be forced to buy the stock. Our new cost basis would be $211.50 ($222.50 purchase price minus $11 option premium). Although the stock has fallen a full 7% in value, we are only down 2.6% because of the money we received for selling the put option.
At this point, we can simply reverse our strategy – selling a call option in order to get paid for selling the shares. We will again be selling an out-of-the money option, thus demanding a price higher than it trades today. We own the stock for $211.50. It now trades for $206 Looking out another 2-3 weeks, we can sell the $210 call option for $8.00 per share. This immediately puts another $800 into our account and lowers our cost basis again to $203.50 ($222.50 - $11 put option - $8 call option)
If Tesla stock climbs above $210 over the next few weeks, the shares will automatically be sold from our account at the $210 price. And since we own the stock for just $203.50, this represents a gain of 3.2% - nothing to write home about, but not bad for a one-month trade. If, on the other hand, Tesla remains below $210 when our option expires, we can simply repeat the process – selling another near-term call option above the current price and further lowering our cost basis.
Sellers are able to make consistent profits. Buyers almost always lose over the long-term. This strategy is not without risk, however.
It is far safer than most approaches and even carries less risk than simply buying stock outright – but it is not foolproof.
If a stock falls dramatically, losses can still be had. For that reason, I recommend only selling puts against stocks you are ready and willing to own.
When implied volatility is high because everyone is buying –so sell options. Use the implied volatility manipulation to your advantage.
If you insist on selling naked puts against riskier equities, do so in smaller amounts. My personal allocation per trade is as follows:
Large Cap Blue Chips (Home Depot, Wal-Mart, Berkshire Hathaway)
● Up to 10% per trade
2nd Tier Stocks (First Solar, Netflix, 3D Systems)
● Up to 5% per trade
Speculative Trades (turnarounds, small caps, new IPO’s)
● Up to 3% per trade; 10% of portfolio or less
But as a general rule of thumb, anything above 40% IV is considered high.
Earnings announcements can be used as an opportunity to sell puts against great
stocks at temporarily depressed prices.
If you want another great options guide then I recommend downloading Bill Poulos' "Simple Options Trading For Beginners" guide
IBD information to Buy to Sell etc
எhttps://www.investors.com/how-to-invest/when-to-sell-stocks/ When to sell stocks. https://www.investors.com/how-to-invest/how-to-buy-sto...
-
எhttps://www.investors.com/how-to-invest/when-to-sell-stocks/ When to sell stocks. https://www.investors.com/how-to-invest/how-to-buy-sto...
-
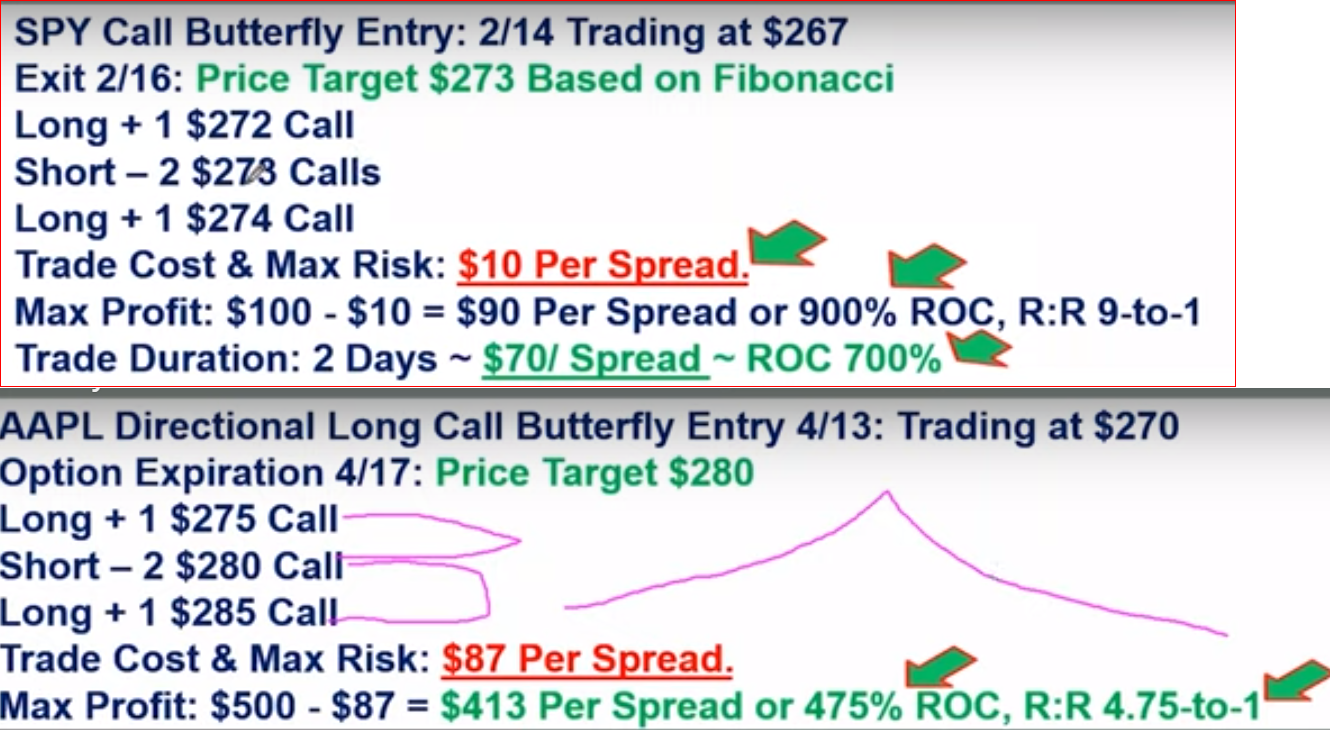
Assuming XYZ trading at 45 Directional price target 43. Buy to Open 44 PUT @2.38 2 Sell to open 43 PUT @1.67 Buy to Open 42 PUT @ 1.06 N...