வியாழன், 3 டிசம்பர், 2020

Option idea or strategy from others

Let’s assume the stock falls 7% over the next 12 days leading up to the option’s expiration date. First of all, this is a pretty big move. It is unlikely, but we will use it for this example. A 7% decline in Tesla stock would put shares at $206. And since this is below the 222.5 put we sold, we would be forced to buy the stock. Our new cost basis would be $211.50 ($222.50 purchase price minus $11 option premium). Although the stock has fallen a full 7% in value, we are only down 2.6% because of the money we received for selling the put option.

At this point, we can simply reverse our strategy – selling a call option in order to get paid for selling the shares. We will again be selling an out-of-the money option, thus demanding a price higher than it trades today. We own the stock for $211.50. It now trades for $206 Looking out another 2-3 weeks, we can sell the $210 call option for $8.00 per share. This immediately puts another $800 into our account and lowers our cost basis again to $203.50

($222.50 - $11 put option - $8 call option)

Sellers are able to make consistent profits. Buyers almost always lose over the long-term. This strategy is not without risk, however It is far safer than most approaches and even carries less risk than simply buying stock outright – but it is not foolproof.

If a stock falls dramatically, losses can still be had. For that reason, I recommend only selling puts against stocks you are ready and willing to own.

Everyone buying = Increased IV

● Market makers receive more $ for selling

● Traders over pay for options

Everyone selling = Decreased IV

● Market makers spend less when buying

● Traders receive less premium than they

When implied volatility is high because everyone is buying –so sell options. Use the implied volatility manipulation to your advantage.

() If you insist on selling naked puts against riskier equities, do so in smaller amounts. My personal allocation per trade is as follows:

Large Cap Blue Chips (Home Depot, Wal-Mart, Berkshire Hathaway)  ● Up to 10% per trade

2nd Tier Stocks (First Solar, Netflix, 3D Systems)  ● Up to 5% per trade

Speculative Trades (turnarounds, small caps, new IPO’s)  ● Up to 3% per trade; 10% of portfolio or less.

My new found strategy.

CALL Buy

Look Haikin-Aschi candle. Consider this after Minimum 5 red candle. Day by day it became small and small. look wicks and candle size. When current Lower wick is higher, than previous lower wick that means Current candle body and wick should be smaller than previous candle and wick,  look HMA (10,20) EMA (3,8) it has to turn then buy at strike on .4 delta with 90 or 150 day expiration. Chances are high for it to get higher in few days.  Choose sector leading stocks for max profit. 

SELL - if you get 40% profit. Spread (width 1 risk 1 reward, not 10 or 20) is good. Buy 2 get profit 60/80% min second.

PUT sell

Look Haikin-Aschi candle. Consider this after Minimum 5 green candle. Day by day it became small and small. look wicks and candle size. When current candle higher wick  & close is lower than previous candle higher wick and close (Current candle body should be smaller than previous candle.), look HMA (10,20) EMA (3,8) it has to turn then buy at strike on .4 delta with 90 or 150 day expiration. Chances are high for it to get lower in few days.  Choose sector leading stocks for max profit. 

SELL - if you get 40% profit. Spread (width 1 risk 1 reward, not 10 or 20) is good. Buy 2 get profit 60/80% min second.

Hit and Run  

ITM around .7 delta , make sure volume is low when buying , lot of open interest mt 1000, tight ask-bid spread less than 7% is ok 5% is good 2% is perfect, if it does not move within a week close or reevaluate position to eliminate loss!, always look for the tightest bid / ask spread to minimize slippage.

If Earnings are 2 weeks away don’t buy/enter. Don’t buy immediately after earnings, allow 3-4 days or 2 weeks to settle.

** 3 by 8 Trap **

Buy an option or stock if it is in 3×8 trap green candle , do not buy if it is red candle. If price is above 3x8 trap, wait it will come down to 3x8 trap. Draw trend line if price comes down to trend line and if it is in 3x8 trap enter trade.

சனி, 2 மே, 2020

Option Strategies like big banks and institutions

90% traders lose money. Why? The answer - inflated implied volatility.
Implied volatility is artificially skewed by market makers on a regular basis, especially on out-of the-money options.
only one variable is manually set by market makers is volatility. They cannot change other greeks.

In these one-sided markets, option traders are actually dealing directly with market makers instead of another option trader. This is why implied volatility tends to rise in a bear market and drop in a bull market. In a bear market, traders usually rush into put options all at once. In a bull market, the buying of call options tends to be more spread out and less "hurried". Is it making sense?

Everyone buying = Increased IV
● Market makers receive more $ for selling
● Traders over pay for options
Everyone selling = Decreased IV
● Market makers spend less when buying
● Traders receive less premium than they

● 100 shares of TSLA: $22,200
● 50% margin requirement: $11,100
● Option premium received: $1,100
● Gain on successful trade: 10% in 12 days
Now I know what you’re thinking. “Yeah…but what if the stock falls below $222?” Let’s explore that. Let’s assume the stock falls 7% over the next 12 days leading up to the option’s expiration date.
First of all, this is a pretty big move. It is unlikely, but we will use it for this example. A 7% decline in Tesla stock would put shares at $206. And since this is below the 222.5 put we sold, we would be forced to buy the stock. Our new cost basis would be $211.50 ($222.50 purchase price minus $11 option premium). Although the stock has fallen a full 7% in value, we are only down 2.6% because of the money we received for selling the put option.

At this point, we can simply reverse our strategy – selling a call option in order to get paid for selling the shares. We will again be selling an out-of-the money option, thus demanding a price higher than it trades today. We own the stock for $211.50. It now trades for $206 Looking out another 2-3 weeks, we can sell the $210 call option for $8.00 per share. This immediately puts another $800 into our account and lowers our cost basis again to $203.50 ($222.50 - $11 put option - $8 call option)

If Tesla stock climbs above $210 over the next few weeks, the shares will automatically be sold from our account at the $210 price. And since we own the stock for just $203.50, this represents a gain of 3.2% - nothing to write home about, but not bad for a one-month trade. If, on the other hand, Tesla remains below $210 when our option expires, we can simply repeat the process – selling another near-term call option above the current price and further lowering our cost basis.

Sellers are able to make consistent profits. Buyers almost always lose over the long-term. This strategy is not without risk, however.
It is far safer than most approaches and even carries less risk than simply buying stock outright – but it is not foolproof.
If a stock falls dramatically, losses can still be had. For that reason, I recommend only selling puts against stocks you are ready and willing to own.

When implied volatility is high because everyone is buying –so sell options. Use the implied volatility manipulation to your advantage.

If you insist on selling naked puts against riskier equities, do so in smaller amounts. My personal allocation per trade is as follows:
Large Cap Blue Chips (Home Depot, Wal-Mart, Berkshire Hathaway)
 ● Up to 10% per trade
2nd Tier Stocks (First Solar, Netflix, 3D Systems)
 ● Up to 5% per trade
Speculative Trades (turnarounds, small caps, new IPO’s)
 ● Up to 3% per trade; 10% of portfolio or less

But as a general rule of thumb, anything above 40% IV is considered high.
Earnings announcements can be used as an opportunity to sell puts against great
stocks at temporarily depressed prices.

If you want another great options guide then I recommend downloading Bill Poulos' "Simple Options Trading For Beginners" guide


வியாழன், 12 மார்ச், 2020

BULL BEAR INVERSE ETF LIST

https://www.direxion.com/leveraged-inverse-etfs
BEAR
MUTE Daily Communication Services
TAWK Daily Communication Services
PASS Daily Consumer Discretionary
LACK Daily Consumer Staples
WEBS Daily Dow Jones Internet
ERY Daily Energy
GASX Daily Natural Gas Related
FAZ Daily Financial
DRV Daily MSCI Real Estate
WDRW    Daily Regional Banks
HIBS Daily S&P 500® High Beta
LABD Daily S&P Biotech
DRIP     Daily S&P Oil & Gas Exp. & Prod.
SOXS Daily Semiconductor
TECS      Daily Technology
SPXS      Daily S&P 500
TZA Daily Small Cap
SAGG     Daily Total Bond Market
SPDN Daily S&P 500


BULL
TAWK     Daily Communication Services
WANT     Daily Consumer Discretionary 
NEED Daily Consumer Staples
WEBL     Daily Dow Jones Internet
ERX        Daily Energy 
FAS         Daily Financial 
CURE Daily Healthcare 
NAIL       Daily Homebuilders & Supplies
DUSL      Daily Industrials 
DRN        Daily MSCI Real Estate
GASL      Daily Natural Gas RelatED
PILL Daily Pharmaceutical & Medical 
DPST Daily Regional Banks 
HIBL Daily S&P 500® High Beta
LABU      Daily S&P Biotech
GUSH     Daily S&P Oil & Gas Exp. & Prod. 
SOXL      Daily Semiconductor
TECL      Daily Technology 
TPOR     Daily Transportation
UTSL      Daily Utilities 
DFEN Daily Aerospace & Defense
 YINN     Daily FTSE China 
INDL      Daily MSCI India 
SPXL      Daily S&P 500 
MIDU     Daily Mid Cap
TNA        Daily Small Cap
CHAU    Daily CSI 300 China A Share
CWEB    Daily CSI China Internet
SPUU      Daily S&P 500 
SMLL      Daily Small Cap 

வெள்ளி, 6 மார்ச், 2020

Festival of traders

February 


March - 2020

Butterfly and Long condor options


Don't buy immediately after gap, wait for pull back then enter.

OPTIONS - Big Trends 
It uses CCI , ADX and William %R indicators.

Buy option $1.00 or less minus gamma  option to hit home runs.
At-least go for 5 days if stock is flat or moving against us then sell, use Trailing  stop to sell.

He does not if one or two indicator shows positive direction,  if all 3 indicators shows positive  then he buys.

April 2020


சனி, 29 பிப்ரவரி, 2020

Daytradesafe Strategy DAY TRADE


DAY TRADE

405 tick per day
use 27min 9 min 3 min 1 min chart
1 min very noisy so for forex so use 27, 9, 3 min instead of 9 3 1 min chart.


  • unison of 3 charts is very strong
  • unison of 2 chart is good


if 3 charts goes in same direction that is very strong, otherwise 2 timeframe,  mostly 1 and 3 .
use trailing stop


TradingTheOpen.com Ken Calhoun


  • After Gap wait for 2 days to make trade
  • 45 degree angle best chart
  • Don't buy any thing in 9 in it. 9 is exit zone.
  • After 3 or 4 green candle if red comes look at that size. if red size is small (relatively to green) it will go up. Mostly in trend look size of the candle and opposite color candle that shows trend reversal will happen or not. relatively opp color candles are small means chances are low.


Top Dog

Chaikin money flow UP price down. that Chaikin MF point is entry point.

  • Use Heikin Ashi candles and Fibonacci buy at 61.8% stop-loss is below 61.8. use Tick chart for time frame. 
  • using Trailing stop loss is good. train 1 stick below.
  • Identify the trend and change in trend. 
  • Enter at the start of new trend. 
E-mini


Simple Techniques to Manage Risk and Smooth Returns of Your Day Trading System


Have 5 minute time frame chart from 9.30 to 4.15
Then have custom build chart from 9.29 to 3.14. every bar within the window will now start and end 1 minute early. 

ஞாயிறு, 23 பிப்ரவரி, 2020

Steve brooks strategy

Double the dividend

  • for ex CTL is 13.06
  • Divided is $1.00 (7.66%) for entire year, That is if you keep the stock entire year .25+.25+.25+.25
  • but buy 100 and sell covered call get premium 1.10  (Jan 21 15  call)
  • get dividend .25 and premium 1.10 ((25+110))  and if stock does not go above 15 keep the stock.  
  • if you own the stock for entire year then dividend is $1.00 then it is 100+110 and if stock does not go above 15 keep the stock.
2/13 Webinar

Buy SPY on Monday sell on Friday if previous week SP 500 is down -.5 to -3 %


Two SETUPS (Weekly and Monthly)

  1. Buy SPY on Monday at 9.30 AM, Sell on Friday 3.58 PM  if previous week SP 500 is down -.5 to -3 %
  2. Buy SPY Monday 3.58 PM sell on Tuesday 3.58 PM 

At 9.30 EST every Monday check to see if the previous week in the SP 500 was down between -0.5% to -3.0%.  if yes, BUY @ 9.30 , sell Friday 3.55

GLD
Thursday 9.30 BUY & Friday 3.59 SELL


சனி, 8 பிப்ரவரி, 2020

PTS Steven Primo's Strategy

Strategy #1
50 SMA
21 period Donchain Channel
all 3 lines have to go in same direction.

BUY set-up
Step #1
price has to be above 50 SMA and all 3 lines of Donchain channels are in upward direction.

Step #2
the rising price bar begins to decline and is now completely  "below" the mid-line channel.
(SET-UP BAR)

STRATEGY #9
In an overall Up-trend Buy signals will be generated during a decline.
In an overall Down-trend Sell signals will be generated during a rally.


Five Exit Strategies
1. RANGE EXTENSION
buy any where, but that day range is 100%
200% means risk/reward is 1:1 300% means 1:2


2. PIVOT HIGHS AND LOWS
Put SL 1 tick below pivot joining point.


3. 9 PERIOD EMA
see if it closes below 9EMA or setup SL 1 tick below the price after it crosses below 9 EMA.


4. SLOW STOCHASTIC
Change default 14 to 5.

5. ADVANCED CANDLE STICKS
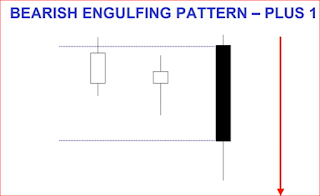
Engulfing (plus 1)


Steven Primo Catching Big Trends With Bollinger Bands & STRATEGY #3A

Modified -default 20 SMA & 0.382 deviation instead of 2.

3A Rules Step by Step


if 3 consecutive candles are close from 50SMA line then overall trend is down.
STRATEGY #10

SET-UP

  • Shallow BUY pullback 1-3 day sell-off in a short-term up trend.
  • Shallow SELL pullback 1-3 day bounce in a short-term down trend
  • Buying and Selling in "Continuation" of the short-term trend.


புதன், 5 பிப்ரவரி, 2020

Real Life

Optimizing Bearish Technical Analysis Jan 22
Trade Machine and Optimizing Bearish Technical Analysis and Stock Option Backtesting.

 put-options
10, 21 Day EMA
50, 200 daybSMA
RSI(20)


ஞாயிறு, 2 பிப்ரவரி, 2020

Options

Vector Vest - - Call, PUT credit spread
Go for PUT spread if trend is bullish
Go for CALL spread if trend is bearish.


  • current price - strike =  intrinsic value
  • premium -  intrinsic value =  extrinsic value
  • Options with intrinsic value are classified as in the money (ITM). 
  • If an option has a delta from .51 to 1.00, it’s in the money. If it has a delta of .50, it’s at the money. And if it has a delta of .00 to .49, it’s out of the money.
  • Gamma grow larger as an option nears expiration. 
  • Buyers generally prefer options with smaller theta, while sellers generally prefer options with larger theta. Like gamma, theta tends to be largest in ATM options.
  • If an option has a Vega of .01, the options premium will likely increase $0.01 with each 1 percentage point change in implied volatility.

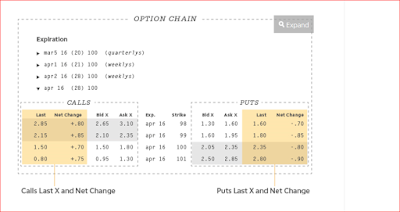
last and net change. Last refers to the last price—the amount at which the option last traded. Net change calculates the difference between today’s closing price and the previous trading day’s closing price. It’s a quick way to tell whether the option increased or decreased in value since the previous trading day.
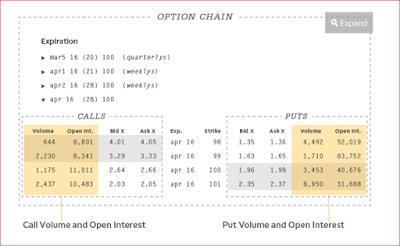
For example, on the thinkorswim platform the bid and ask prices are the areas you’ll click to open a new order ticket and place a trade. If you’re buying a long call or long put, click the corresponding ask price. If you’re selling a short call or short put, click the corresponding bid price.

A good guideline is to only consider options with a bid/ask spread that is 10% or less of the ask price. To calculate this, subtract the bid price from the ask price, and then divide the answer by the ask price. 
Bid - SELL

Ask - BUY

RULE OF 5 PROFIT SYSTEM -  OPTIONS IT WORKS WELL FOR STOCKS TOO. 

Trade in 3 minute time frame find W pattern for buy , M pattern for sell . I think we use bollinger band to find this and it's direction.


$5,000 Portfolio / 5 = $1,000 per Trade
if you get profit or loss, make it in portfolio again divide by 5 then trade. That is make the portfolio in compound. Compound is powerful tool than any other.


In this way you can make 5,000 in to 25,000 or more in one year. 

Look at Discover the Exact Four Strategies for Making Consistent Investment Income - FEB 15, 2020 in Tiger trade 2020 or in options folder for video.
How to Decide Between Debit and Credit Spreads in Your Options Trading 02-27-20

WHAT IS VERTICAL SPREAD?
BUY ONE OPTION
SELL ANOTHER (SAME TYPE)
BOTH HAVE SAME EXPIRATION
BUY NOV$.50 CALL, SELL NOV$.55 CALL
50/55 VERTICAL SPREAD

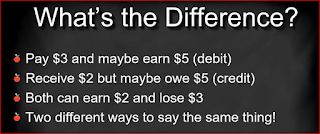
DEBIT SPREAD --ASSET
CREDIT SPREAD -- LIABILITY

Buy 50/55 Call spread
Buy $50 call
Sell $55 call
This is Debit spread 50 Call cost more.
Right to buy for 50, Obligation to sell for 55. May earn $5 (difference in strike).

Buyer pays debit, Seller receives credit. 
Buyer has an asset, Seller has an liability.,

Sell  50/55 Call spread
Buy $55 call
Sell $50 call
This is Credit spread 
Right to buy for 55, Obligation to sell for 50. May owe $5 (difference in strike).
Selling a call spread is liability 

Buy 50/55 Put spread
Buy $55 Put
Sell $50 Put
This is Debit spread .
Right to sell for 55, Obligation to buy for 50. May earn $5 (difference in strike).
Buying a Put spread is an asset.

Sell 50/55 Put spread
Buy $50 Put
Sell $55 Put
This is Credit spread .
Right to sell for 50, Obligation to buy for 55. 
May earn $5 (difference in strike).
Selling a Put spread is an Liability.

Buying the Call spread = Selling the corresponding Put spread. 

 Using Current Option-Oriented Indicators for Profits 


This is intermediate trend trade (month or more)
We Buy ATM option with atleast month remaining. 
Delta 0.55 Balances risk of longer holding period with a responsive option.

Wenty's Monthly Income 10000 for 600
Indicators PPO and ADX
Percent price oscillator (PPO) and MACD lare identical but calculations are different.  PPO uses % MACD uses real price (dollor). 

If PPO & ADX both lines is go each direction Buy option. Trade QQQ like highly liquidate options which end at 4.15PM QQQ is preferable by Windy. 
If both lines are looks like meeting that is called P3 Squeeze so both lines go away from P3 Squeeze

Options for the following symbols trade an extra 15 minutes after the close of trading – DBA, DBB, DBC, DBO, DIA, EFA, EEM, GAZ, IWM, IWN, IWO, IWV, JJC, KBE, KRE, MDY, MLPN, MOO, NDX, OEF, OIL, QQQ, SLX, SPY, SVXY, UNG, UUP, UVXY, VIIX, VIXY, VXX, VXZ, XHB, XLB, XLE, XLF, XLI, XLK, XLP, XLU, XLV, XLY, XME, XRT.

VXX ETF reflect Volatility index VIX. 


IBD information to Buy to Sell etc

 எhttps://www.investors.com/how-to-invest/when-to-sell-stocks/   When to sell stocks. https://www.investors.com/how-to-invest/how-to-buy-sto...