Options லேபிளுடன் இடுகைகளைக் காண்பிக்கிறது. அனைத்து இடுகைகளையும் காண்பி

வெள்ளி, 18 ஜூன், 2021

The Math of Unwinding Covered Call Writing Trades Early


j


https://www.moneyshow.com//articles/tradingidea-56792/the-math-of-unwinding-covered-call-writing-trades-early/?scode=015363&utm_campaign=Trading%20Insights%20-%20Daily&utm_medium=email&_hsmi=134467472&_hsenc=p2ANqtz-8OHdNbwgzMSmxciYjNcvIP-yarWVQKVtYmAuh9ozdNpkF3zmWYbxP64FgGA_UDeayfYGwZOhTzq-CGDH1ysVrLz9wIuw&utm_content=134467472&utm_source=hs_email

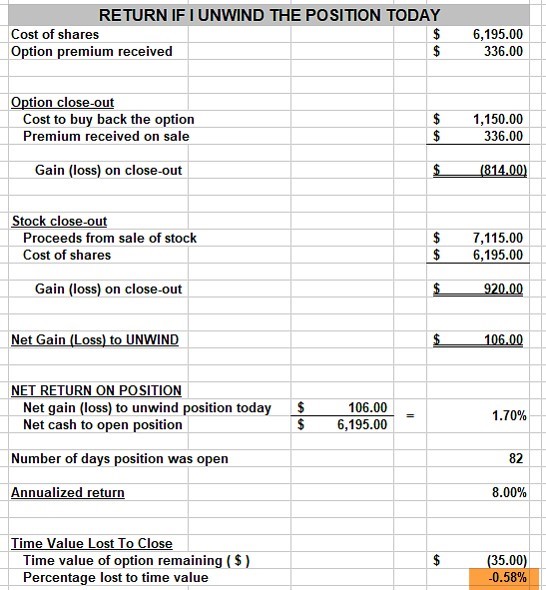
Unwind calculations if both legs of the position are closed on 10/6/2020

Unwind calculations if both legs of the position are closed on 10/6/2020


The time-value cost-to-close (CTC) is 0.58%. There are 10 days remaining to contract expiration. We ask ourselves: Can we generate at least 1% more than the time-value CTC or 1.58% or more with a different security by 10/16/2020? If yes, we execute the mid-contract unwind exit strategy. If no or unsure, we take no action and continue to monitor the trade with possible rolling opportunities as expiration approaches.

Discussion

Exit strategy opportunities must be executed when beneficial to our overall portfolio success. To make these determinations, the BCI Calculators will assist as the formulas are built in to allow us to understand the mathematics of our trades. In the case of Alex’s TAN trade, a successful trade was executed with the possibility of establishing a second income stream in the same contract month with the same cash investment. 


ஞாயிறு, 18 ஏப்ரல், 2021

Option Earnings play - IBD

Why Use Options During Earnings Season

First, look for stocks at or near proper buy points. Most will be building bases. After that, look for a slightly out-of-the-money weekly or monthly call option. This means the strike price is just above the underlying stock price. Every strike price comes with a premium, or the cost of the option. Divide the premium by the stock price, and multiply by 100; this gives you the downside risk for the trade in percentage form. Looks for trades with downside risk of 4% or less.

The strategy is detailed every week in the Earnings Preview column of the IBD Weekly print edition, on page B2.

NVDA example 

One of the early winners since this feature's debut? Check out Nvidia (NVDA), featured in the May 9, 2016, edition of IBD Weekly as it got support at the 10-week moving average.

When shares were trading around 35.50 on May 12, a slightly out-of-the-money weekly call option with a 36 strike price (May 13 expiration) came with a premium of $1.27. That offered a trade with 3.6% downside risk.

Shares gapped up May 13 on earnings and closed at 40.98. The option could have been exercised that day at 36. If you didn't want shares, you could have sold the option itself for a nice profit.

Other winners that arrived in later weeks included Salesforce.com (CRM), Ulta Beauty (ULTA), Lululemon (LULU), Paychex (PAYX), Yum Brands (YUM) and Domino's.

Of course, earnings option plays aren't always going to work, but they're a lower-risk alternative to buying a stock outright ahead of earnings because risk is predefined.

Wells Fargo Stock Earnings Next Week; Options Market Helps Set Expectations

Calculating Expected Move On Wells Fargo Stock

The quickest way to work out the expected move is to look up the option chain and add together the price of the at-the-money put option and the at-the-money call option. We use the first expiration date after the earnings date.

While this approach isn't as accurate as a detailed calculation, it does serve as a reasonable estimate.

Let's take Wells Fargo stock as an example. Earnings are before the open on July 14 so we would use the option chain with a July 16 expiration. The at-the-money call and at-the-money put on Wells Fargo stock are trading just above and below 1.00. The sum of both is roughly 2.05 and that is the expected point move. With Wells Fargo stock trading around 42.50, that's about a 4.8% expected move.

Remember, that doesn't tell you direction. It could be either up or down!


சனி, 9 ஜனவரி, 2021

Smart money -articles (strategies)

Covered Call

Stock Selection

We select the top-performing Dow 30 stocks that have been out-performing the S&P 500 in both three-month and one-year time frames as shown in our BCI Blue Chip Reports.

Option Selection

For this article, I used the first five stocks in the report and checked the option-chains for out-of-the-money strikes that generated 1%-2% for one-month initial time-value returns. I entered the option-chain information into the blue cells of the multiple tab of the Ellman Calculator.

Exit Strategies

Once we have entered a covered-call trade, we move to position-management mode. A complete detailed discussion of exit strategies is beyond the scope of this article, but these include:

    20%/10% guidelines,     “Hitting a double”,     Rolling down,     Selling the stock after closing the short call,     Mid-contract unwind exit strategy,     Rolling-out,     Rolling-out-and-up

EXIT strategy - 

How Do You Create an Exit Strategy?

I personally like to keep it simple. Here’s a simple, yet powerful, profit-taking strategy: P = 2 x R

This means: Take profits when you make twice as much money as you risk. Here’s an example: I highly recommend using the 2% rule for your risk, i.e., you should never risk more than 2% of your trading account on any given trade. So. if you have a $10,000 account, don’t risk more than 2% = $200. When you risk $200, you should take profits as soon as you make $400. With a simple profit-taking strategy like that, you will make money even if you’re wrong half of the time.

in option buy at (.70 delta)  25.00 sell if it comes to 20 so risk is 5. sell at 30 so reqrd is 10 (this is my view)

Advanced Profit-Taking Strategies

Here’s the challenge...when you're using the simple profit-taking strategy that I outlined above, you might leave some profits on the table. Because when a stock is more volatile, you could get 3 x R, or maybe even more. As an example, when you look at the stock SLCA, you could easily get 5 x R, i.e., you could get $1,000 for every $200 that you risk. In this case, what do you do? Do you try to get 5 x R, even though it is more aggressive? Or do you stick with the more conservative 2 x R?

Is There a Best Way to Exit a Trade?

Here’s what I personally like to do. I like to use the best of both worlds. I take profits for 1/2 of my position when I see 2 X R, and then I take the remainder of the profits when the stock gets to my optimized profit target, i.e., 5 x R.

Here’s an example:

Let’s say you’re trading 100 shares of ABC. Your risk is $2 per share, i.e. $200 for 100 shares. Your conservative profit target is 2 X R = 2 x $2 = $4. Your optimized profit target is 5 X R = 5 x $2 = $10.

I personally sell 50 of the 100 shares as soon as I can get $4 in profits per share. In this case, I would make 50 x $4 = $200. Now I cut the stop loss for the remaining 50 shares in half. Instead of risking $2 per share, I will now risk only $1 per share. Since I have 50 shares left, my risk is now reduced from $200 to $50. But the best: since I already sold half of my shares, I already made $200. 

This money has been deposited into my account. So, if the stock turns around now and I get stopped out, I only give back $50 of these $200. Therefore, my total profit for this trade would be $150.

As you can see, once I take profits, I cannot lose on this trade anymore—even if the stock turns around. And if it keeps going up, I can sell the remaining 50 shares when the stock moves up $10, which is my optimized target. In this case, I would realize an additional $500 for a total of $700.

3 Different Profit-Taking Strategies

Let’s recap:

  1.     Conservative Profit Taking Strategy:-      In this case, you would risk $200 to make $400. Not bad.
  2.     Optimized Profit Taking Strategy:-     In this case, you would risk $200 to make $1,000. Sounds better, but it’s less likely. The stock might turn around and you get stopped out before the stock reaches this aggressive target.
  3.     My “Best of Both Worlds” Profit-Taking Strategy:-     In this case, you would risk $200, and as soon as the stock moves up by $4, you take profits for half of your position. Now you can’t lose anymore and have a “free trade” that hopefully achieves your optimized profit target.

I can relax, sit back, and don’t have to worry about this trade anymore. If everything works out, I’m making $700 on this trade. If it doesn’t work out, I still make $150.

Important!

This example is for an account of $10,000, and if you get the $700 in profits, you make 7%—on one trade! That’s pretty good! As you can see, THIS is smart trade management.

**

Price Action

  1. Is price at an area that fits in with my analysis?
  2. Do I have momentum divergence as price entered that area?
  3. Do I have reversal candlestick patterns present at that area?
  4. If conditions 1 -3 are all met, do I have sufficient capital to take a trade associated with the risk on this particular setup?

How to find momentum Divergence

Momentum divergence 

Reversal Candle stick patterns

    Reversal Candlesticks,     Hammer Candlesticks,     Flanked Doji’s

Risk, SL


வியாழன், 3 டிசம்பர், 2020

Option idea or strategy from others

Let’s assume the stock falls 7% over the next 12 days leading up to the option’s expiration date. First of all, this is a pretty big move. It is unlikely, but we will use it for this example. A 7% decline in Tesla stock would put shares at $206. And since this is below the 222.5 put we sold, we would be forced to buy the stock. Our new cost basis would be $211.50 ($222.50 purchase price minus $11 option premium). Although the stock has fallen a full 7% in value, we are only down 2.6% because of the money we received for selling the put option.

At this point, we can simply reverse our strategy – selling a call option in order to get paid for selling the shares. We will again be selling an out-of-the money option, thus demanding a price higher than it trades today. We own the stock for $211.50. It now trades for $206 Looking out another 2-3 weeks, we can sell the $210 call option for $8.00 per share. This immediately puts another $800 into our account and lowers our cost basis again to $203.50

($222.50 - $11 put option - $8 call option)

Sellers are able to make consistent profits. Buyers almost always lose over the long-term. This strategy is not without risk, however It is far safer than most approaches and even carries less risk than simply buying stock outright – but it is not foolproof.

If a stock falls dramatically, losses can still be had. For that reason, I recommend only selling puts against stocks you are ready and willing to own.

Everyone buying = Increased IV

● Market makers receive more $ for selling

● Traders over pay for options

Everyone selling = Decreased IV

● Market makers spend less when buying

● Traders receive less premium than they

When implied volatility is high because everyone is buying –so sell options. Use the implied volatility manipulation to your advantage.

() If you insist on selling naked puts against riskier equities, do so in smaller amounts. My personal allocation per trade is as follows:

Large Cap Blue Chips (Home Depot, Wal-Mart, Berkshire Hathaway)  ● Up to 10% per trade

2nd Tier Stocks (First Solar, Netflix, 3D Systems)  ● Up to 5% per trade

Speculative Trades (turnarounds, small caps, new IPO’s)  ● Up to 3% per trade; 10% of portfolio or less.

My new found strategy.

CALL Buy

Look Haikin-Aschi candle. Consider this after Minimum 5 red candle. Day by day it became small and small. look wicks and candle size. When current Lower wick is higher, than previous lower wick that means Current candle body and wick should be smaller than previous candle and wick,  look HMA (10,20) EMA (3,8) it has to turn then buy at strike on .4 delta with 90 or 150 day expiration. Chances are high for it to get higher in few days.  Choose sector leading stocks for max profit. 

SELL - if you get 40% profit. Spread (width 1 risk 1 reward, not 10 or 20) is good. Buy 2 get profit 60/80% min second.

PUT sell

Look Haikin-Aschi candle. Consider this after Minimum 5 green candle. Day by day it became small and small. look wicks and candle size. When current candle higher wick  & close is lower than previous candle higher wick and close (Current candle body should be smaller than previous candle.), look HMA (10,20) EMA (3,8) it has to turn then buy at strike on .4 delta with 90 or 150 day expiration. Chances are high for it to get lower in few days.  Choose sector leading stocks for max profit. 

SELL - if you get 40% profit. Spread (width 1 risk 1 reward, not 10 or 20) is good. Buy 2 get profit 60/80% min second.

Hit and Run  

ITM around .7 delta , make sure volume is low when buying , lot of open interest mt 1000, tight ask-bid spread less than 7% is ok 5% is good 2% is perfect, if it does not move within a week close or reevaluate position to eliminate loss!, always look for the tightest bid / ask spread to minimize slippage.

If Earnings are 2 weeks away don’t buy/enter. Don’t buy immediately after earnings, allow 3-4 days or 2 weeks to settle.

** 3 by 8 Trap **

Buy an option or stock if it is in 3×8 trap green candle , do not buy if it is red candle. If price is above 3x8 trap, wait it will come down to 3x8 trap. Draw trend line if price comes down to trend line and if it is in 3x8 trap enter trade.

சனி, 2 மே, 2020

Option Strategies like big banks and institutions

90% traders lose money. Why? The answer - inflated implied volatility.
Implied volatility is artificially skewed by market makers on a regular basis, especially on out-of the-money options.
only one variable is manually set by market makers is volatility. They cannot change other greeks.

In these one-sided markets, option traders are actually dealing directly with market makers instead of another option trader. This is why implied volatility tends to rise in a bear market and drop in a bull market. In a bear market, traders usually rush into put options all at once. In a bull market, the buying of call options tends to be more spread out and less "hurried". Is it making sense?

Everyone buying = Increased IV
● Market makers receive more $ for selling
● Traders over pay for options
Everyone selling = Decreased IV
● Market makers spend less when buying
● Traders receive less premium than they

● 100 shares of TSLA: $22,200
● 50% margin requirement: $11,100
● Option premium received: $1,100
● Gain on successful trade: 10% in 12 days
Now I know what you’re thinking. “Yeah…but what if the stock falls below $222?” Let’s explore that. Let’s assume the stock falls 7% over the next 12 days leading up to the option’s expiration date.
First of all, this is a pretty big move. It is unlikely, but we will use it for this example. A 7% decline in Tesla stock would put shares at $206. And since this is below the 222.5 put we sold, we would be forced to buy the stock. Our new cost basis would be $211.50 ($222.50 purchase price minus $11 option premium). Although the stock has fallen a full 7% in value, we are only down 2.6% because of the money we received for selling the put option.

At this point, we can simply reverse our strategy – selling a call option in order to get paid for selling the shares. We will again be selling an out-of-the money option, thus demanding a price higher than it trades today. We own the stock for $211.50. It now trades for $206 Looking out another 2-3 weeks, we can sell the $210 call option for $8.00 per share. This immediately puts another $800 into our account and lowers our cost basis again to $203.50 ($222.50 - $11 put option - $8 call option)

If Tesla stock climbs above $210 over the next few weeks, the shares will automatically be sold from our account at the $210 price. And since we own the stock for just $203.50, this represents a gain of 3.2% - nothing to write home about, but not bad for a one-month trade. If, on the other hand, Tesla remains below $210 when our option expires, we can simply repeat the process – selling another near-term call option above the current price and further lowering our cost basis.

Sellers are able to make consistent profits. Buyers almost always lose over the long-term. This strategy is not without risk, however.
It is far safer than most approaches and even carries less risk than simply buying stock outright – but it is not foolproof.
If a stock falls dramatically, losses can still be had. For that reason, I recommend only selling puts against stocks you are ready and willing to own.

When implied volatility is high because everyone is buying –so sell options. Use the implied volatility manipulation to your advantage.

If you insist on selling naked puts against riskier equities, do so in smaller amounts. My personal allocation per trade is as follows:
Large Cap Blue Chips (Home Depot, Wal-Mart, Berkshire Hathaway)
 ● Up to 10% per trade
2nd Tier Stocks (First Solar, Netflix, 3D Systems)
 ● Up to 5% per trade
Speculative Trades (turnarounds, small caps, new IPO’s)
 ● Up to 3% per trade; 10% of portfolio or less

But as a general rule of thumb, anything above 40% IV is considered high.
Earnings announcements can be used as an opportunity to sell puts against great
stocks at temporarily depressed prices.

If you want another great options guide then I recommend downloading Bill Poulos' "Simple Options Trading For Beginners" guide


ஞாயிறு, 2 பிப்ரவரி, 2020

Options

Vector Vest - - Call, PUT credit spread
Go for PUT spread if trend is bullish
Go for CALL spread if trend is bearish.


  • current price - strike =  intrinsic value
  • premium -  intrinsic value =  extrinsic value
  • Options with intrinsic value are classified as in the money (ITM). 
  • If an option has a delta from .51 to 1.00, it’s in the money. If it has a delta of .50, it’s at the money. And if it has a delta of .00 to .49, it’s out of the money.
  • Gamma grow larger as an option nears expiration. 
  • Buyers generally prefer options with smaller theta, while sellers generally prefer options with larger theta. Like gamma, theta tends to be largest in ATM options.
  • If an option has a Vega of .01, the options premium will likely increase $0.01 with each 1 percentage point change in implied volatility.

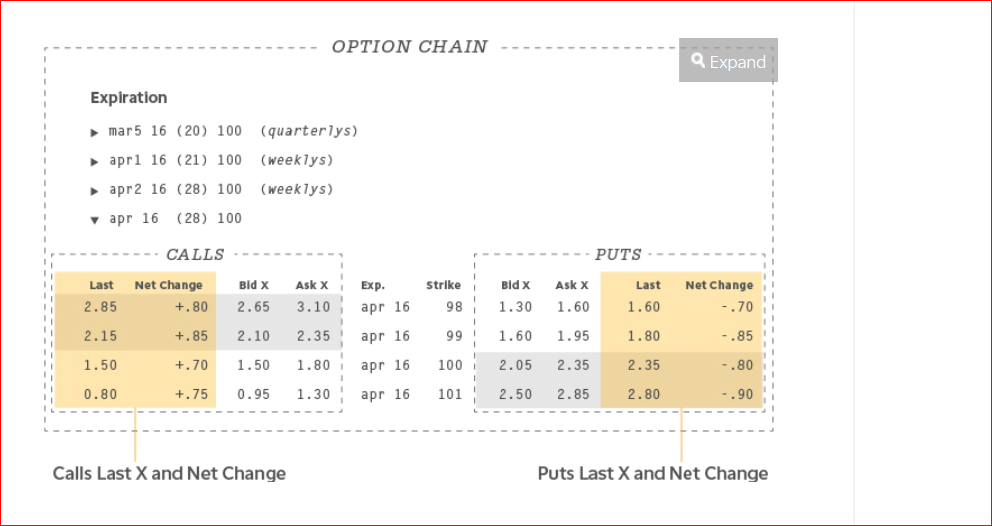
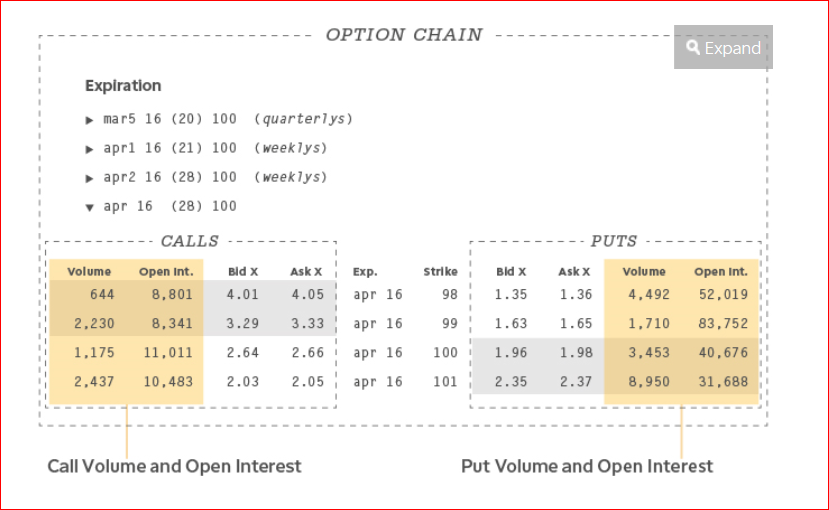
last and net change. Last refers to the last price—the amount at which the option last traded. Net change calculates the difference between today’s closing price and the previous trading day’s closing price. It’s a quick way to tell whether the option increased or decreased in value since the previous trading day.
For example, on the thinkorswim platform the bid and ask prices are the areas you’ll click to open a new order ticket and place a trade. If you’re buying a long call or long put, click the corresponding ask price. If you’re selling a short call or short put, click the corresponding bid price.

A good guideline is to only consider options with a bid/ask spread that is 10% or less of the ask price. To calculate this, subtract the bid price from the ask price, and then divide the answer by the ask price. 
Bid - SELL

Ask - BUY

RULE OF 5 PROFIT SYSTEM -  OPTIONS IT WORKS WELL FOR STOCKS TOO. 

Trade in 3 minute time frame find W pattern for buy , M pattern for sell . I think we use bollinger band to find this and it's direction.


$5,000 Portfolio / 5 = $1,000 per Trade
if you get profit or loss, make it in portfolio again divide by 5 then trade. That is make the portfolio in compound. Compound is powerful tool than any other.


In this way you can make 5,000 in to 25,000 or more in one year. 

Look at Discover the Exact Four Strategies for Making Consistent Investment Income - FEB 15, 2020 in Tiger trade 2020 or in options folder for video.
How to Decide Between Debit and Credit Spreads in Your Options Trading 02-27-20

WHAT IS VERTICAL SPREAD?
BUY ONE OPTION
SELL ANOTHER (SAME TYPE)
BOTH HAVE SAME EXPIRATION
BUY NOV$.50 CALL, SELL NOV$.55 CALL
50/55 VERTICAL SPREAD

DEBIT SPREAD --ASSET
CREDIT SPREAD -- LIABILITY

Buy 50/55 Call spread
Buy $50 call
Sell $55 call
This is Debit spread 50 Call cost more.
Right to buy for 50, Obligation to sell for 55. May earn $5 (difference in strike).

Buyer pays debit, Seller receives credit. 
Buyer has an asset, Seller has an liability.,

Sell  50/55 Call spread
Buy $55 call
Sell $50 call
This is Credit spread 
Right to buy for 55, Obligation to sell for 50. May owe $5 (difference in strike).
Selling a call spread is liability 

Buy 50/55 Put spread
Buy $55 Put
Sell $50 Put
This is Debit spread .
Right to sell for 55, Obligation to buy for 50. May earn $5 (difference in strike).
Buying a Put spread is an asset.

Sell 50/55 Put spread
Buy $50 Put
Sell $55 Put
This is Credit spread .
Right to sell for 50, Obligation to buy for 55. 
May earn $5 (difference in strike).
Selling a Put spread is an Liability.

Buying the Call spread = Selling the corresponding Put spread. 

 Using Current Option-Oriented Indicators for Profits 


This is intermediate trend trade (month or more)
We Buy ATM option with atleast month remaining. 
Delta 0.55 Balances risk of longer holding period with a responsive option.

Wenty's Monthly Income 10000 for 600
Indicators PPO and ADX
Percent price oscillator (PPO) and MACD lare identical but calculations are different.  PPO uses % MACD uses real price (dollor). 

If PPO & ADX both lines is go each direction Buy option. Trade QQQ like highly liquidate options which end at 4.15PM QQQ is preferable by Windy. 
If both lines are looks like meeting that is called P3 Squeeze so both lines go away from P3 Squeeze

Options for the following symbols trade an extra 15 minutes after the close of trading – DBA, DBB, DBC, DBO, DIA, EFA, EEM, GAZ, IWM, IWN, IWO, IWV, JJC, KBE, KRE, MDY, MLPN, MOO, NDX, OEF, OIL, QQQ, SLX, SPY, SVXY, UNG, UUP, UVXY, VIIX, VIXY, VXX, VXZ, XHB, XLB, XLE, XLF, XLI, XLK, XLP, XLU, XLV, XLY, XME, XRT.

VXX ETF reflect Volatility index VIX. 


IBD information to Buy to Sell etc

 எhttps://www.investors.com/how-to-invest/when-to-sell-stocks/   When to sell stocks. https://www.investors.com/how-to-invest/how-to-buy-sto...