ஞாயிறு, 18 ஏப்ரல், 2021

Determine Stock Market Bottoms - IBD time the market

 When the market is in a correction, how do you know when that trend has changed and it's time to buy stocks again?

Wait for a "follow-through day."

IBD's ongoing study of every market cycle since 1880 has found that no bull market has ever started without a follow-through day. So instead of relying on hunches or predictions, wait for this time-tested signal to confirm the market has hit bottom and a new uptrend has begun.

Key Elements of a Follow-Through:

  • New Low
    • When the market is in a downtrend, look for at least one of the major indexes (mainly the S&P 500 or Nasdaq Composite) to hit a new price low.
  • Attempted Rally
    • After hitting a new low, look for a day when the index closes higher. That might mean the index has stopped its decline, established a new "bottom," and is on its way to a rebound.
    • But one up day isn't enough to tell if the market trend has truly changed. So we count that as Day 1 of an attempted rally.
    • From there, as long as the index stays above the previous low, the attempted rally remains in place.
  • Follow-Through Day: Big Gain in Rising Volume
    • A follow-through day indicates the attempted rally has succeeded.
    • To count as a follow-through day, at least one major index needs to close up 1.25% or higher in volume heavier than the prior day. Volume does NOT have to be above average; just higher than the prior day.
    • Follow-throughs typically occur anytime from Day 4 or later in the attempted rally. They can happen as early as Day 3, but the first three days are usually too soon to confirm a new uptrend.

Get Back in Gradually After a Follow-Through Day

Not every follow-through day leads to a big, sustained uptrend. About 25% - 30% will fail, and the market will quickly fall back into a correction. That's why you want to get back into the market gradually when a follow-through day occurs and the Market Pulse shifts from "Market in correction" to "Confirmed uptrend."

If the uptrend takes hold and leading CAN SLIM® stocks start to move higher on heavy buying by institutional investors, you can start to get in more aggressively. If the uptrend fails, follow your sell rules and move safely back to the sidelines.

Watch Out for Distribution Days

If you see distribution days within just a few days after the follow-through, look out! It could mean the nascent uptrend is not taking hold and will quickly fall back into a correction. Regularly check the Market Pulse for the current distribution day count and any alerts to changes in trend.

The Big Money is Made in the Early Stages of New Uptrends

As noted earlier, the biggest winners tend to launch new price runs right at the beginning of a new uptrend.

It's all part of the market cycle: During the prior correction, they form base patterns. Then they break out as the market direction changes, often on the actual follow-through day or within the next two — three weeks.

The examples below show how that same phenomenon happens year after year.


Option Earnings play - IBD

Why Use Options During Earnings Season

First, look for stocks at or near proper buy points. Most will be building bases. After that, look for a slightly out-of-the-money weekly or monthly call option. This means the strike price is just above the underlying stock price. Every strike price comes with a premium, or the cost of the option. Divide the premium by the stock price, and multiply by 100; this gives you the downside risk for the trade in percentage form. Looks for trades with downside risk of 4% or less.

The strategy is detailed every week in the Earnings Preview column of the IBD Weekly print edition, on page B2.

NVDA example 

One of the early winners since this feature's debut? Check out Nvidia (NVDA), featured in the May 9, 2016, edition of IBD Weekly as it got support at the 10-week moving average.

When shares were trading around 35.50 on May 12, a slightly out-of-the-money weekly call option with a 36 strike price (May 13 expiration) came with a premium of $1.27. That offered a trade with 3.6% downside risk.

Shares gapped up May 13 on earnings and closed at 40.98. The option could have been exercised that day at 36. If you didn't want shares, you could have sold the option itself for a nice profit.

Other winners that arrived in later weeks included Salesforce.com (CRM), Ulta Beauty (ULTA), Lululemon (LULU), Paychex (PAYX), Yum Brands (YUM) and Domino's.

Of course, earnings option plays aren't always going to work, but they're a lower-risk alternative to buying a stock outright ahead of earnings because risk is predefined.

Wells Fargo Stock Earnings Next Week; Options Market Helps Set Expectations

Calculating Expected Move On Wells Fargo Stock

The quickest way to work out the expected move is to look up the option chain and add together the price of the at-the-money put option and the at-the-money call option. We use the first expiration date after the earnings date.

While this approach isn't as accurate as a detailed calculation, it does serve as a reasonable estimate.

Let's take Wells Fargo stock as an example. Earnings are before the open on July 14 so we would use the option chain with a July 16 expiration. The at-the-money call and at-the-money put on Wells Fargo stock are trading just above and below 1.00. The sum of both is roughly 2.05 and that is the expected point move. With Wells Fargo stock trading around 42.50, that's about a 4.8% expected move.

Remember, that doesn't tell you direction. It could be either up or down!


வியாழன், 15 ஏப்ரல், 2021

Scott Welsh strategies

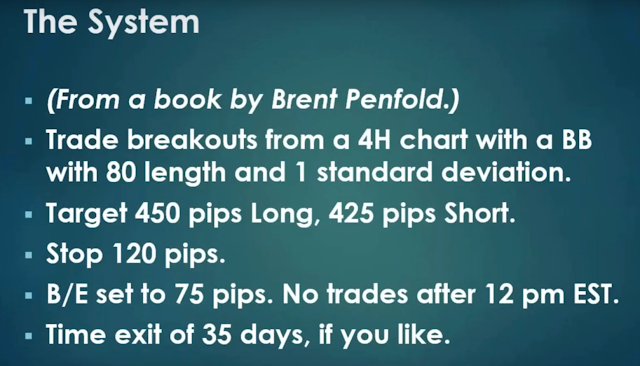
 Bollinger Band strategy.

1. 80 length (SMA) and 1 Std deviation on 4 hour time frame.

buy (Long) on next day if price breaks out upper BB. Sell if price breaks lower BB.

2. 100 length (SMA) and 3 Std deviation on 1 hour time frame.

buy (Long) on next day if price breaks out upper BB. Sell if price breaks lower BB.

3. 20 length (SMA) and 2.3 Std deviation on 4 hour time frame.

buy (Long) on next day if price breaks out upper BB. Sell if price breaks lower BB.

Images for forex but it will work for stocks.


4 Hour chart length 80 1 std Div

1 Hour 100 length 3 Std.Div


-

சனி, 3 ஏப்ரல், 2021

How to Time the Bottom in Stocks


How to Time the Bottom in Stocks: A Three-Step Trading Method

Rule - 

Candle color is not a matter/issue.

  1. Weekly chart must undercut previous 3 weeks.
  2. Chart must close above prior weeks close.
  3. Must have above average volume on point 2 candle.

Money management rules for stock trades.

  • Enter at open on Monday using market order.
  • Sell half at 8% (Target 1)
  • Stop- loss max 10%
  • Once hits Target 1, raise SL to break even on remaining shares.
  • Trail 1% behind 50SMA on remaining shares. 

Candle color is not an issue.
Red, Green, Red. Picture 1
Red, Red, Red Picture 2, 3
Chances are high for the stock to go up if green candle is bigger than 3rd red candle (engulfing candle) 


IBD information to Buy to Sell etc

 எhttps://www.investors.com/how-to-invest/when-to-sell-stocks/   When to sell stocks. https://www.investors.com/how-to-invest/how-to-buy-sto...