வியாழன், 31 அக்டோபர், 2019

நாள் வணிகம் இச்சேசன் பாண்ட் என்பவரின் உத்தி

இச்சேசன் பாணடு என்பவரின் உத்தி இது விலை அதிகளவில் கீழே  இறங்கினால் அப்புறம் மேலே ஏறும் கொக்கி போல் அப்ப வாங்கி சிறிது ஏறினதும் விற்று விட வேண்டும்.

இவர் இவ்வுத்தியை Optionஇல் பயன்படுத்தி வரவு ஈட்டுகிறார்.


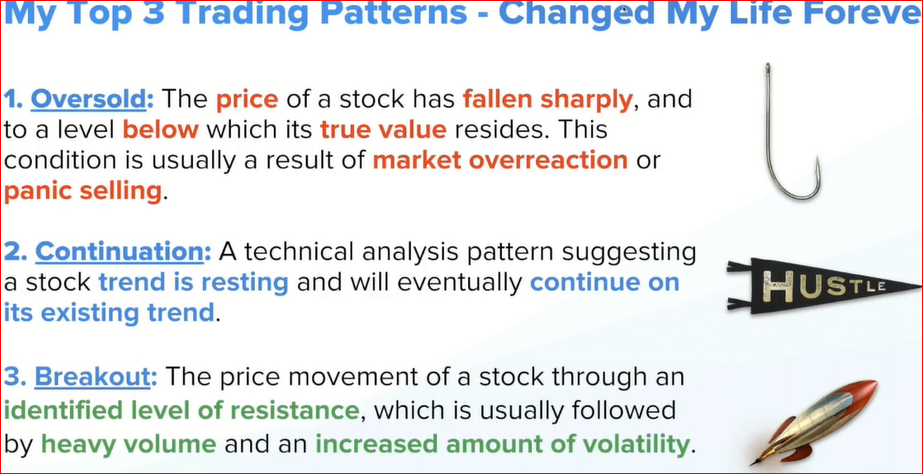
அவரின் புகழ்பெற்ற மூன்று ஒழுங்குகள்.

  1.  RSI என்பது 30இக்கும் கீழ் இருக்கவேண்டும், அப்படி இருந்தால் பங்கு அதிகளவில் விற்கப்பட்டுள்ளதை  குறிக்கும். 70இக்கும்  மேல் இருந்தால் அதிகம் வாங்கப்பட்டுள்ளதை குறிக்கும். அப்ப பங்கின் விலை மீன் கொக்கி போல் கீழ் வந்து மேல் எழும் நேரத்தில் பங்கை வாங்கி சிறிது நேரத்தில் விற்று விட    வேண்டும்.
  2. விலை உயர்ததும் போக்கு பக்கவாட்டில் சில நாள் சென்று பின் மீண்டும்  ஏறுமுக போக்கு தொடரும்.
  3. ஆதரவு-தடையில் தடையை விலை தொட்டதும் அதிக பங்கு கொள்ளளவு ஏற்பட்டு விலை மேலும் கீழும் மாறும் அது விலையில் பெரும் மாறுதல் ஏற்படும் என்பதன் அறிகுறி.


k

 கிட்ட தட்ட 50% முதல் இரு வாரங்களுக்குள் விற்ற பின் ஏதோ நல்ல செய்தி  வந்ததால் விலை ஏறுகிறது.  கவனிக்க  RSI - 30இக்கும் கீழ் போய் பின் மேலேறுகிறது. 


k


Use Call option if you thing prices go up then buy and sold
Use put option if you thing price will go down, put and sell.

வெக்டாரின் உத்தி

 வெக்டார் வெசுட்டு என்பவர்களின் வெப்பெக்சில் மூன்று உத்திகள்  மூலம் பங்கு வணிகம் செய்ய கூறுகிறார்கள்.

  1.  போக்கு பங்காக  இருந்தால்  MACD என்ற நுட்பஅலசல் காட்டியை பயன்படுத்த கூறுகிறார்கள். இதில்  Stochastic ஐ பயன்படுத்த வேண்டாம் என்கிறார்கள். 
  2.  ஆதரவு  - தடை (support-resistance) என்பது இன்னொரு உத்தி. இதில் விலை மேலும் கீழும்  போகும், இதை வணிகர்களின் ஆட்டத்திற்கு ஏற்றது என்கிறார்கள். இதில் Stochastic கையும் பயன்படுத்தலாம்.
  3. விலை கடுமையாக இறங்கினால், ஏறினால் அதாவது சந்தை கடும் போக்கில் இருந்தால் Stochastic ஐ பயன்படுத்த வேண்டுமாம். 
முதல் போக்கின் போது  வாங்கவும் போக்கு திரும்பினால் விற்றுவிடவும்.


28% விலை அதிகமானதும் விற்று வரவு பார்க்கவும், 7%இக்கு மேல் வாங்கினதை விட விலை குறைந்தால் விற்று விடவும்.

சனி, 5 அக்டோபர், 2019

Strategy from webinar

Heikil-Ashi candle chart candle strategy
use 15 or 20 day MA to find trend.
Buy green candle if it comes after red candle or red candle if it comes after green candle

Draw support Resistance line.
if it touches support 3 times 4th time it comes to support chances are high it breaks support and move downward at-least support-Resistance height.

RSI zones - 4 zones
bottom bear support zone
above bull support zone
above bear resistance zone
above bull resistance zone

1-2-3 Strategy 
have separate detailed post

Ichimoku cloud
buy in Chickou Span (Lagging Span) top, sell after 5 minutes (use ATR to gauge increase) 5 min chart. use ATR if i is 5 or more, trade only big volatility stocks in this method like AAPL, AMZN, TSLA, GOog, nflx, baba, fb, avgo, ulta,

Oracle Trader 
Buy on 148th trading day then 30th day from that sell
148th day AAPl 202.5 148+30= 178 178th day AAPL is 210.6
used AAPL for example,   check 100 different stocks and try diff days.
we can use this strategy to buy option.


Apart from strategy they use few other Momentum,  Trend, Volume indicators, look candle stick pattern and initiate Buy.

Will update periodically whenever i see new webinar.

IBD information to Buy to Sell etc

 எhttps://www.investors.com/how-to-invest/when-to-sell-stocks/   When to sell stocks. https://www.investors.com/how-to-invest/how-to-buy-sto...