சனி, 29 பிப்ரவரி, 2020

Daytradesafe Strategy DAY TRADE


DAY TRADE

405 tick per day
use 27min 9 min 3 min 1 min chart
1 min very noisy so for forex so use 27, 9, 3 min instead of 9 3 1 min chart.


  • unison of 3 charts is very strong
  • unison of 2 chart is good


if 3 charts goes in same direction that is very strong, otherwise 2 timeframe,  mostly 1 and 3 .
use trailing stop


TradingTheOpen.com Ken Calhoun


  • After Gap wait for 2 days to make trade
  • 45 degree angle best chart
  • Don't buy any thing in 9 in it. 9 is exit zone.
  • After 3 or 4 green candle if red comes look at that size. if red size is small (relatively to green) it will go up. Mostly in trend look size of the candle and opposite color candle that shows trend reversal will happen or not. relatively opp color candles are small means chances are low.


Top Dog

Chaikin money flow UP price down. that Chaikin MF point is entry point.

  • Use Heikin Ashi candles and Fibonacci buy at 61.8% stop-loss is below 61.8. use Tick chart for time frame. 
  • using Trailing stop loss is good. train 1 stick below.
  • Identify the trend and change in trend. 
  • Enter at the start of new trend. 
E-mini


Simple Techniques to Manage Risk and Smooth Returns of Your Day Trading System


Have 5 minute time frame chart from 9.30 to 4.15
Then have custom build chart from 9.29 to 3.14. every bar within the window will now start and end 1 minute early. 

ஞாயிறு, 23 பிப்ரவரி, 2020

Steve brooks strategy

Double the dividend

  • for ex CTL is 13.06
  • Divided is $1.00 (7.66%) for entire year, That is if you keep the stock entire year .25+.25+.25+.25
  • but buy 100 and sell covered call get premium 1.10  (Jan 21 15  call)
  • get dividend .25 and premium 1.10 ((25+110))  and if stock does not go above 15 keep the stock.  
  • if you own the stock for entire year then dividend is $1.00 then it is 100+110 and if stock does not go above 15 keep the stock.
2/13 Webinar

Buy SPY on Monday sell on Friday if previous week SP 500 is down -.5 to -3 %


Two SETUPS (Weekly and Monthly)

  1. Buy SPY on Monday at 9.30 AM, Sell on Friday 3.58 PM  if previous week SP 500 is down -.5 to -3 %
  2. Buy SPY Monday 3.58 PM sell on Tuesday 3.58 PM 

At 9.30 EST every Monday check to see if the previous week in the SP 500 was down between -0.5% to -3.0%.  if yes, BUY @ 9.30 , sell Friday 3.55

GLD
Thursday 9.30 BUY & Friday 3.59 SELL


சனி, 8 பிப்ரவரி, 2020

PTS Steven Primo's Strategy

Strategy #1
50 SMA
21 period Donchain Channel
all 3 lines have to go in same direction.

BUY set-up
Step #1
price has to be above 50 SMA and all 3 lines of Donchain channels are in upward direction.

Step #2
the rising price bar begins to decline and is now completely  "below" the mid-line channel.
(SET-UP BAR)

STRATEGY #9
In an overall Up-trend Buy signals will be generated during a decline.
In an overall Down-trend Sell signals will be generated during a rally.


Five Exit Strategies
1. RANGE EXTENSION
buy any where, but that day range is 100%
200% means risk/reward is 1:1 300% means 1:2


2. PIVOT HIGHS AND LOWS
Put SL 1 tick below pivot joining point.


3. 9 PERIOD EMA
see if it closes below 9EMA or setup SL 1 tick below the price after it crosses below 9 EMA.


4. SLOW STOCHASTIC
Change default 14 to 5.

5. ADVANCED CANDLE STICKS
Engulfing (plus 1)


Steven Primo Catching Big Trends With Bollinger Bands & STRATEGY #3A

Modified -default 20 SMA & 0.382 deviation instead of 2.

3A Rules Step by Step


if 3 consecutive candles are close from 50SMA line then overall trend is down.
STRATEGY #10

SET-UP

  • Shallow BUY pullback 1-3 day sell-off in a short-term up trend.
  • Shallow SELL pullback 1-3 day bounce in a short-term down trend
  • Buying and Selling in "Continuation" of the short-term trend.


புதன், 5 பிப்ரவரி, 2020

Real Life

Optimizing Bearish Technical Analysis Jan 22
Trade Machine and Optimizing Bearish Technical Analysis and Stock Option Backtesting.

 put-options
10, 21 Day EMA
50, 200 daybSMA
RSI(20)


ஞாயிறு, 2 பிப்ரவரி, 2020

Options

Vector Vest - - Call, PUT credit spread
Go for PUT spread if trend is bullish
Go for CALL spread if trend is bearish.


  • current price - strike =  intrinsic value
  • premium -  intrinsic value =  extrinsic value
  • Options with intrinsic value are classified as in the money (ITM). 
  • If an option has a delta from .51 to 1.00, it’s in the money. If it has a delta of .50, it’s at the money. And if it has a delta of .00 to .49, it’s out of the money.
  • Gamma grow larger as an option nears expiration. 
  • Buyers generally prefer options with smaller theta, while sellers generally prefer options with larger theta. Like gamma, theta tends to be largest in ATM options.
  • If an option has a Vega of .01, the options premium will likely increase $0.01 with each 1 percentage point change in implied volatility.

last and net change. Last refers to the last price—the amount at which the option last traded. Net change calculates the difference between today’s closing price and the previous trading day’s closing price. It’s a quick way to tell whether the option increased or decreased in value since the previous trading day.
For example, on the thinkorswim platform the bid and ask prices are the areas you’ll click to open a new order ticket and place a trade. If you’re buying a long call or long put, click the corresponding ask price. If you’re selling a short call or short put, click the corresponding bid price.

A good guideline is to only consider options with a bid/ask spread that is 10% or less of the ask price. To calculate this, subtract the bid price from the ask price, and then divide the answer by the ask price. 
Bid - SELL

Ask - BUY

RULE OF 5 PROFIT SYSTEM -  OPTIONS IT WORKS WELL FOR STOCKS TOO. 

Trade in 3 minute time frame find W pattern for buy , M pattern for sell . I think we use bollinger band to find this and it's direction.


$5,000 Portfolio / 5 = $1,000 per Trade
if you get profit or loss, make it in portfolio again divide by 5 then trade. That is make the portfolio in compound. Compound is powerful tool than any other.


In this way you can make 5,000 in to 25,000 or more in one year. 

Look at Discover the Exact Four Strategies for Making Consistent Investment Income - FEB 15, 2020 in Tiger trade 2020 or in options folder for video.
How to Decide Between Debit and Credit Spreads in Your Options Trading 02-27-20

WHAT IS VERTICAL SPREAD?
BUY ONE OPTION
SELL ANOTHER (SAME TYPE)
BOTH HAVE SAME EXPIRATION
BUY NOV$.50 CALL, SELL NOV$.55 CALL
50/55 VERTICAL SPREAD

DEBIT SPREAD --ASSET
CREDIT SPREAD -- LIABILITY

Buy 50/55 Call spread
Buy $50 call
Sell $55 call
This is Debit spread 50 Call cost more.
Right to buy for 50, Obligation to sell for 55. May earn $5 (difference in strike).

Buyer pays debit, Seller receives credit. 
Buyer has an asset, Seller has an liability.,

Sell  50/55 Call spread
Buy $55 call
Sell $50 call
This is Credit spread 
Right to buy for 55, Obligation to sell for 50. May owe $5 (difference in strike).
Selling a call spread is liability 

Buy 50/55 Put spread
Buy $55 Put
Sell $50 Put
This is Debit spread .
Right to sell for 55, Obligation to buy for 50. May earn $5 (difference in strike).
Buying a Put spread is an asset.

Sell 50/55 Put spread
Buy $50 Put
Sell $55 Put
This is Credit spread .
Right to sell for 50, Obligation to buy for 55. 
May earn $5 (difference in strike).
Selling a Put spread is an Liability.

Buying the Call spread = Selling the corresponding Put spread. 

 Using Current Option-Oriented Indicators for Profits 


This is intermediate trend trade (month or more)
We Buy ATM option with atleast month remaining. 
Delta 0.55 Balances risk of longer holding period with a responsive option.

Wenty's Monthly Income 10000 for 600
Indicators PPO and ADX
Percent price oscillator (PPO) and MACD lare identical but calculations are different.  PPO uses % MACD uses real price (dollor). 

If PPO & ADX both lines is go each direction Buy option. Trade QQQ like highly liquidate options which end at 4.15PM QQQ is preferable by Windy. 
If both lines are looks like meeting that is called P3 Squeeze so both lines go away from P3 Squeeze

Options for the following symbols trade an extra 15 minutes after the close of trading – DBA, DBB, DBC, DBO, DIA, EFA, EEM, GAZ, IWM, IWN, IWO, IWV, JJC, KBE, KRE, MDY, MLPN, MOO, NDX, OEF, OIL, QQQ, SLX, SPY, SVXY, UNG, UUP, UVXY, VIIX, VIXY, VXX, VXZ, XHB, XLB, XLE, XLF, XLI, XLK, XLP, XLU, XLV, XLY, XME, XRT.

VXX ETF reflect Volatility index VIX. 


சனி, 1 பிப்ரவரி, 2020

Meta stock -

12/11/19

If you don't test it Don't trade it.
Many strategies are vague and subject to interpretation in order to make them difficult to impossible test
don't victim of that trap.
ex copper ( RIO, COPX, BHP, FCX, SCCO )

Knoxville Divergence 
He used Momentum Indicator and relative strength index (RSI)
if price goes down but momentum goes up that creates divergence.

MEM research - Mary Ellen McGonagle 
How to increase returns using Growth and Income 

Key ways to uncover top candidates 
  • Industry group of stock is outperforming markets. 
  • Growth prospects are promising.
  • Stocks has sound reason for doing well.
  • Institutions are involved in stock.
  • Economic backdrop supports a continued moved higher.
How to pinpoint Entry and Exit points.
  • Stock pulls back to key MA. (High moving stock pulls back to key MA) - Entry 
  • Volume then picks up as it moves away from MAV - Entry
  • Stock breaks out of or forms right side of base. - Entry
  • Stock drops below key  support on volume while broader market go higher. (not good sign so Exit)
AVGO, SBX are growth stocks. MCD is yield stock.
Dividend Aristocrat stocks.- steady Grower (THOSE STOCKS ARE LISTED IN WIKIPEDIA under Dividend Aristocrat)
CTAS

Thank you for attending Trading Call Options in MetaStock 17 for Substantial Gains 01/29/20


Trader summit February 2020 -  2/17/20
Doji rule
Price will move inn the direction of how price opens after Doji
Top Ranked signals

  1. Your best friend -It is Doji  (Doji followed by gap and Doji appear in oversold area of stochastic. )
  2. Left/Right combo
  3. Series of doji
  4. Candlestick signal followed by gap ups
  5. Kicker signal
  6. Bullish Flutter kicker
  7. Inverted Hammer
  8. Magnitude of signal
Bearish best friend.
Doji gaps down in over bought area.
Left/Right combo - left is Doji Right is Big candle stick, if it is white and appears in oversold area price go up. Left is doji and Right is red candle stick and it appears in overbought area and crossed  T-line then it is bearish signal.
Bullish Doji sandwich - Bullish candle then Doji on top of that candle then Bullish candle on top of doji. Both candle looks same size and 2nd candle is above T-line. Expectation is more up side.

Prime trade select - Chuck Hughes
Purchase stocks or CALL on buy signal.
Purchase PUT or inverse ETF on sell signal.

Step-1
EMA Trend System Rules

A Stock is on EMA 'buy' signal when the 50-day EMA is above 100-day EMA

A Stock is on EMA 'sell' signal when the 50-day EMA is below 100-day EMA

Step-2
use Keltner channel to find Lower risk entry points for stocks and options.

Stocks normally trade inside channel. when it goes above channel it is getting over bought and normally trades lower (circled)


Notice the Subsequent price declines when HD stock trades above upper channel.


When a stock trades below upper channel it is in a Keltner "Buy Zone" and the stock or call option can be purchased.

Step-3
Use the '1% rule' to select an option strike price with higher percentage of winning trades

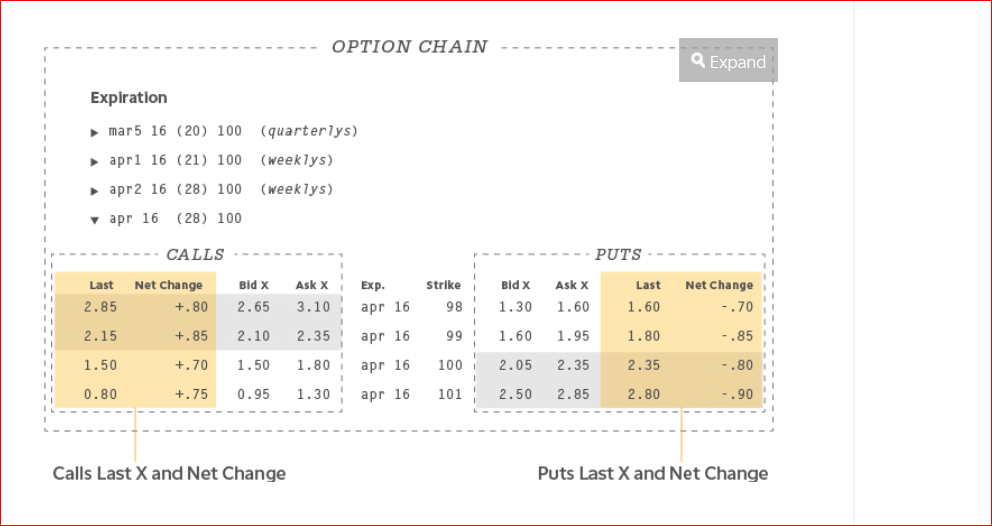
How do you determine which strike price to trade?
-Selecting a strike price can be just as important as the stock selection itself.

-Option premiums consist of time value and intrinsic value.
time + intrinsic = option premium 


Each day before option expiration, the time value portion of an option decays. 

The greatest amount of the time decay occurs in the last 30 days before option expiration. 

Time value <1% of stock price.
The stock price needs to increase 1% in order for the opti0n trade to start profiting.

When you use 1% rule, the option intrinsic value willl increase 100 for each 1 point increase in the underlying stock.

for ex-
XLU current price 54.36
strike price 40
Intersic value = 14.36 (54.36-40)
time as per 1% rule = .54

Option premium = 14.80
Intersinc value = 14.36
so time value is .44 (14.80 - 14.36)

.44 is less than 1% of the 54.36 ( .54) stock price so this strike price qualifies under 1% rule.

in this example XLU only needs to increase .44 for the trade to break even and start profiting.

A 1% price increase to profit has a much higher probability of being profitable than an at-the-money or out-of-the money strike price that can require up to a 5 to 10% or greater price increase option expiration to profit.

Many times the expected stock price move will not occur before option expiration.

OPTIONSTRATEGISTdotCOM -McMILLIAN ANALYSIS CORP


 Asia Online Traders Summit  FEB 22-20


Online Traders Summit - March 21, 2020

Strong breaks result in large moves


IBD information to Buy to Sell etc

 எhttps://www.investors.com/how-to-invest/when-to-sell-stocks/   When to sell stocks. https://www.investors.com/how-to-invest/how-to-buy-sto...