வியாழன், 6 ஜூலை, 2023

IBD information to Buy to Sell etc

 எhttps://www.investors.com/how-to-invest/when-to-sell-stocks/   When to sell stocks.

https://www.investors.com/how-to-invest/how-to-buy-stocks-using-stock-lists-stock-ratings-stock-screener/ How to buy stocks


Stock Market Timing: How To Handle Bull Markets And Bear Markets By Tracking Changing Stock Market Trends (investors.com) -- time the market

What Is A Follow-Through Day? | Investor's Business Daily (investors.com) - Follow through day


When To Sell And The Rule Of 72

Take the percentage gain you have in a stock. Divide 72 by that number. The answer tells you how many times you have to compound that gain to double your money.

For example, if you get three 24% gains (72÷3=24) — and reinvest your profits each time — you will nearly double your money. It's much easier to get three 20%-25% gains out of different stocks than it is to get a 100% profit out of one stock.


When Not To Sell Stocks: 8-Week Hold Rule

Here's an exception to the rule for taking most profits in the 20%-25% range.

If your stock gains more than 20% from the ideal buy point within three weeks of a proper breakout, hold it for at least eight weeks. (The week of the breakout counts as week 1.)

If a stock has the power to jump more than 20% so quickly out of a proper chart pattern, it could have what it takes to become a huge winner. The 8-week hold rule helps you identify such leading growth stocks, letting you sit tight to reap potentially exceptional returns.

This rule should be applied to true stock market leaders, not just any old stock.

Sitting Tight Through A Sell-Off

When a stock quickly rises more than 20% in just a couple of weeks, it's likely some investors will take their profits off the table. That can cause the stock to pull back, sometimes sharply.

So understand that stocks that trigger the 8-week hold rule often sell off fairly hard during the holding period. This rule helps you sit through that and avoid selling too soon.

Once the eight weeks from the original buy point have passed, you can sell to lock in your gains or continue to hold.

If you have a solid gain, and the stock chart and stock market indexes still look healthy, you may want to sit tight and see how the story plays out. It could be a stock that goes on to even bigger gains.


புதன், 31 ஆகஸ்ட், 2022

How To Predict A Breakout Using FLAT Chart Pattern

Flat bases are unique because the stock moves sideways for weeks. A flat base will often form after a stock successfully breaks out from a cup or other type of base. From there, the stock will then stall for a period of time, and this price action is what forms the flat base.

Breakout stocks: How to spot a Flat base

Often the stock moves sideways due to a weak or sideways market. When the overall market finally begins to rally, the stock will move higher out of the flat area. 

Despite the mundane look of it, the flat base actually reflects hidden strength. Instead of bending lower, like a stock would when forming a cup without a handle or cup with handle, the price holds steady. This action tells you there's a lot of bullish pressure on the stock to run higher.

Key Traits of Flat base

First, a flat base must build for at least five weeks. From there, it can extend for much longer, as long as the stock maintains a horizontal pattern.

Second, flat bases are typically more narrow than other bases in terms of the percentage decline from the stock's high to low. The decline usually ranges from 10% to 15%. If you find a stock that's declined more than 15%, it would likely qualify as a cup with handle or other type of base.

Finally, investors must wait to buy the stock until it rises 10 cents above the highest price in the flat base. Once the stock has moved more than 5% above the buy point, don't chase it. Otherwise, you're more likely to get caught in a normal pullback.

Example

Nvidia formed a flat base that began building back in August of 2016. Nvidia's flat base completed with a breakout in September of 2016 and was a total of five weeks long. The highest point of the base, 63.50, plus 10 cents gave a proper buy point of 63.60. During the week of Sept. 23, 2016, Nvidia stock broke out above the buy point in heavy volume. With any breakout, look for volume at least 40% above the stock's average turnover.


வெள்ளி, 31 டிசம்பர், 2021

How to Calculate annualized percentage


How to Calculate annualized.

Nov 15 written.

Strike -60

If EXP is NOV 26

how many to expire - 11 days , we add 1 day extra for calculation

Premium = 0.6 for 60 STR, so got $60 for 100 stocks

(60/12) * 360 = ABC

in financial world 1 year = 360 days.


60*100=6000 if assigned we have to have 6000 to buy the stock.

ABC / 6000


Rate of capital.

Credit spread 205 / 210, got $ 2 

so mar profit for that spread 10 got 2. so 10-2 = 8

2/8 = 0.25 that means 25% is returned for $10. $20 is capital.


ஞாயிறு, 24 அக்டோபர், 2021

Should We Short a Put to Help Fund a Collar Trade?

1. Covered call trade + protective put.

2. Collar trade has 3 legs

  • -Long STOCK (buy)
  • -Short call (sell)
  • - Long Put (buy)

3. Should we add a 4th leg by selling PUT as well?

-To fund the protective put.

All traded on 10/9/2018

  • Buy 100 NVDA at 264.24 (now a long stock position)
  • Sell 1x 265 call at 14.45 (now a covered trade)
  • Buy 1x 250 Put at 8.20 (now a collar trade)
  • Sell 1x 245 put for 6.65 (covered call on the upside and bear put spread on the bottom side)


Adding a Short Put to fund the cost of the Long Put: Advantages

  • By generating a premium of $6.65, $8.20 cost of the protective put is reduced to $1.55
  • The initial calculations then became:                                                                                 -14.45 - 1.555 = $12.90 = 4.9% ( on a cost basis of $264.24)
  • This is more than double the collar initial time value return

Adding a Short Put to fund the cost of the Long Put: Disadvantages

  • By selling the deeper OTM put (245.00 strike) we are  incurring additional risk to the downside. 
  • If the price moves below 245.00 strike, we start losing money on that leg of the trade as the strike now is in ITM and has an intrinsic value component.
  • That risk can be quantified in a worst case scenario a follows:-            
  • 245-6.65 = 238.35 per share
  • Of course we would take exit strategy steps before letting the trade get that far out of control, but the risk should be understood and qualified before entering the trade.

  • Discussion
  • When establishing our covered call positions ,  we must define3 our personal risk-tolerance and set up our trades accordingly.. 
  • If we require additional protection to the downsize, a protective put is a reasonable approach.
  • Like most insurance policies, we must pay for this protection and our initial results will then decline.
  • If a short put added to mitigate the cost of Long put, we 2ill then be adding additional risk which is what we were trying to avoid by buying the protective put.
 * https://www.youtube.com/watch?v=TcF12X4uljg&t=435s 

புதன், 20 அக்டோபர், 2021

Explaining “Bought-Up” Value When Rolling a Covered Call Out-And-Up

 We can roll out to the same strike at a later date or out-and-up to a higher strike at a later date. For both, there will be an intrinsic-value cost-to-close. When we roll out-and-up, we will benefit from share value being worth more than prior to closing the original short call. In our BCI methodology, this gain is referred to as bought-up value. This article will detail all the explanatory calculations.

Hypothetical trade

  • 5/24/2021: Buy 100 x BCI at $48.00.
  • 5/24/2021: STO (sell-to-open) 6/18/2021 $50.00 call at $1.50.
  • 6/18/2021: BCI is trading at $52.00 as expiration approaches.
  • 6/18/2021: BTC (buy-to-close) the 6/18/2021 $50.00 call at $2.10 ($2.00 intrinsic-value + $0.10 time-value).
  • 6/18/2021: STO the 7/16/2021 $55.00 call at $1.00 (rolling-out-and-up).

Initial trade structuring (multiple tab of the Ellman Calculator)

BCI - initial calculations

The initial time-value return is 3.1% (yellow cell) with the possibility of an additional 4.2% of upside potential (brown cell) if BCI moves up to or above the $50.00 strike by expiration. As long as the contract obligation to sell at $50.00 is in place, our shares cannot be worth more than $50.00. This is how the trade is structured.

Rolling-out-and-up: information into the “What Now” tab of the BCI Calculators 


Rolling-Out-And-Up Data Entries

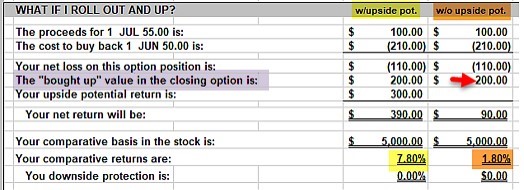
Rolling-out-and-up: final calculations from the “What Now” tab of the Ellman Calculators 

BCI: Rolling-Out-And-Up Final Calculations

BCI: Rolling-Out-And-Up Final Calculations

The bought-up value is $2.00 per share or $200.00 per-contract. This is because shares can only be worth $50.00 with the original short call in place, but once the short call is closed, shares are worth market value of $52.00. This bought-up value must be incorporated into our calculations since we paid for it in the form of intrinsic-value cost-to-close.

The final calculations show an initial time value + bought-up value combined return of 1.8% (brown cell). If share price moves up to the new out-of-the-money $55.00 strike by expiration (an additional $3.00 per-share), the total one-month return will be 7.80% (Yellow cell).

Discussion

When rolling an ITM strike out-and-up, there will be an intrinsic-value cost-to-close. There will also be an unrealized increase in share value by that intrinsic value amount. In the BCI methodology, this is known as bought-up value and must be incorporated into our rolling calculations.


திங்கள், 28 ஜூன், 2021

BUTTER FLY


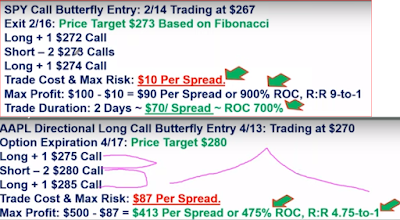
Assuming XYZ trading at 45 Directional price target 43.

Buy to Open 44 PUT @2.38
2 Sell to open 43 PUT @1.67
Buy to Open 42 PUT @ 1.06

Net debit = (2.38+1.06) - 2*1.67 =0.1 ($10 per spread is RISK)

Max Reward
Max profit = (Middle strike - Lower strike - Net debit)*100
Assume XYZ closed at $43 at expiration
M<ax profit = 43-42-$0.1 = 90*100 = $90 per spread

ROC = 90/10 = 900% or R-R of 9 to 1.


IBD Butterfly NVDA example July

Buy 1 July 16, 715 call @ 56.95
Sell 2 July 16, 765 calls @ 25.50
Buy 1 July 16, 815 call @ 9.35
The total cost of the trade is $1,530 and that is the maximum loss potential.


The maximum gain is $3,470. We calculate it by taking the difference in strike prices less the premium paid ($5,000 less $1,530). The break-even prices are 730.30 and 799.70 (765 plus and minus 34.70). A butterfly trade has a tent-like shape with the potential for large profits around the short strike. It is important to keep in mind that achieving the maximum profit is a rare occurrence. So, a good aim for a butterfly trade is to make a 20% return on capital at risk. In this case that would be around $306.

In terms of risk management, I would adjust or close if either of the break-even prices were touched.

IBD information to Buy to Sell etc

 எhttps://www.investors.com/how-to-invest/when-to-sell-stocks/   When to sell stocks. https://www.investors.com/how-to-invest/how-to-buy-sto...