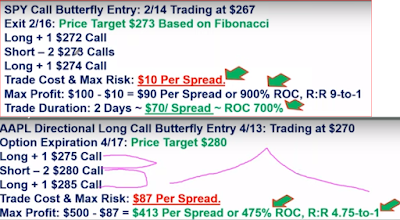
Assuming XYZ trading at 45 Directional price target 43.
Buy to Open 44 PUT @2.38
2 Sell to open 43 PUT @1.67
Buy to Open 42 PUT @ 1.06
Net debit = (2.38+1.06) - 2*1.67 =0.1 ($10 per spread is RISK)
Max Reward
Max profit = (Middle strike - Lower strike - Net debit)*100
Assume XYZ closed at $43 at expiration
M<ax profit = 43-42-$0.1 = 90*100 = $90 per spread
ROC = 90/10 = 900% or R-R of 9 to 1.
IBD Butterfly NVDA example July
Buy 1 July 16, 715 call @ 56.95
Sell 2 July 16, 765 calls @ 25.50
Buy 1 July 16, 815 call @ 9.35
The total cost of the trade is $1,530 and that is the maximum loss potential.
The maximum gain is $3,470. We calculate it by taking the difference in strike prices less the premium paid ($5,000 less $1,530). The break-even prices are 730.30 and 799.70 (765 plus and minus 34.70). A butterfly trade has a tent-like shape with the potential for large profits around the short strike. It is important to keep in mind that achieving the maximum profit is a rare occurrence. So, a good aim for a butterfly trade is to make a 20% return on capital at risk. In this case that would be around $306.
In terms of risk management, I would adjust or close if either of the break-even prices were touched.


கருத்துகள் இல்லை:
கருத்துரையிடுக