திங்கள், 28 ஜூன், 2021

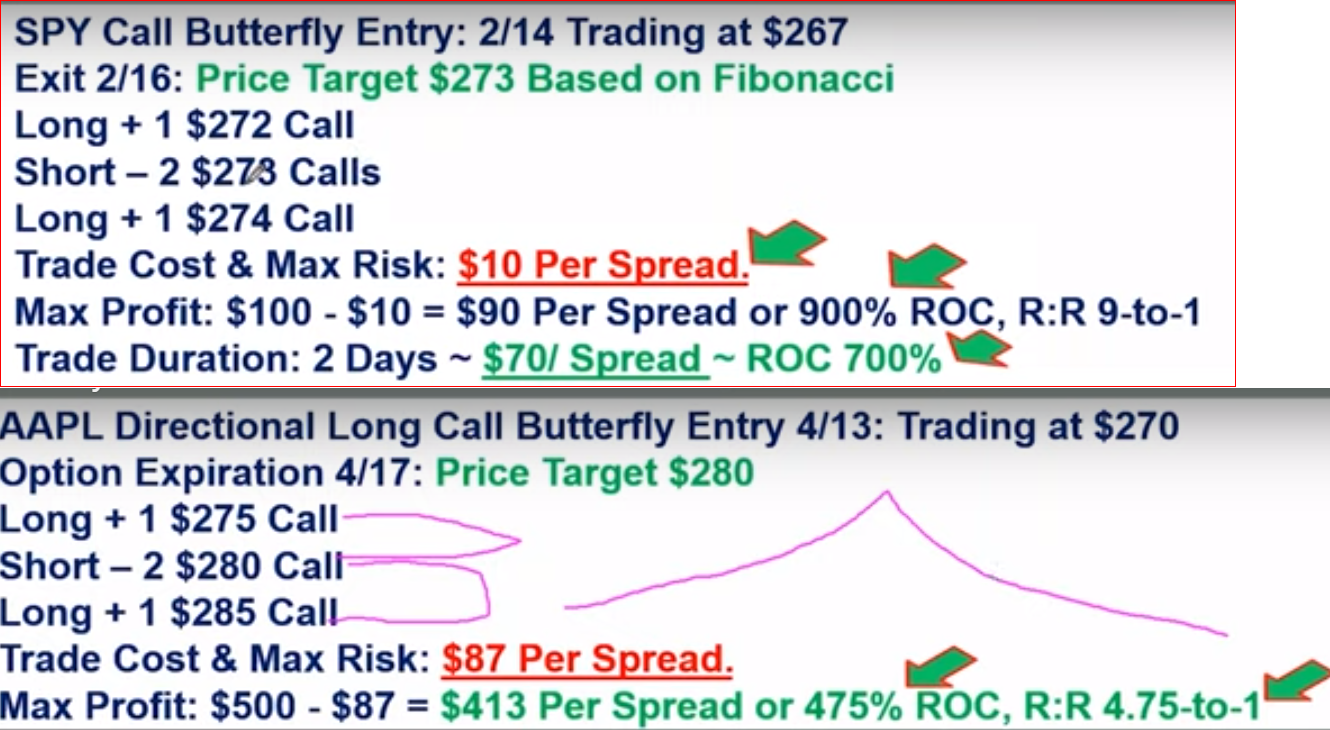
BUTTER FLY


Assuming XYZ trading at 45 Directional price target 43.

Buy to Open 44 PUT @2.38
2 Sell to open 43 PUT @1.67
Buy to Open 42 PUT @ 1.06

Net debit = (2.38+1.06) - 2*1.67 =0.1 ($10 per spread is RISK)

Max Reward
Max profit = (Middle strike - Lower strike - Net debit)*100
Assume XYZ closed at $43 at expiration
M<ax profit = 43-42-$0.1 = 90*100 = $90 per spread

ROC = 90/10 = 900% or R-R of 9 to 1.


IBD Butterfly NVDA example July

Buy 1 July 16, 715 call @ 56.95
Sell 2 July 16, 765 calls @ 25.50
Buy 1 July 16, 815 call @ 9.35
The total cost of the trade is $1,530 and that is the maximum loss potential.


The maximum gain is $3,470. We calculate it by taking the difference in strike prices less the premium paid ($5,000 less $1,530). The break-even prices are 730.30 and 799.70 (765 plus and minus 34.70). A butterfly trade has a tent-like shape with the potential for large profits around the short strike. It is important to keep in mind that achieving the maximum profit is a rare occurrence. So, a good aim for a butterfly trade is to make a 20% return on capital at risk. In this case that would be around $306.

In terms of risk management, I would adjust or close if either of the break-even prices were touched.

வெள்ளி, 18 ஜூன், 2021

The Math of Unwinding Covered Call Writing Trades Early


j


https://www.moneyshow.com//articles/tradingidea-56792/the-math-of-unwinding-covered-call-writing-trades-early/?scode=015363&utm_campaign=Trading%20Insights%20-%20Daily&utm_medium=email&_hsmi=134467472&_hsenc=p2ANqtz-8OHdNbwgzMSmxciYjNcvIP-yarWVQKVtYmAuh9ozdNpkF3zmWYbxP64FgGA_UDeayfYGwZOhTzq-CGDH1ysVrLz9wIuw&utm_content=134467472&utm_source=hs_email

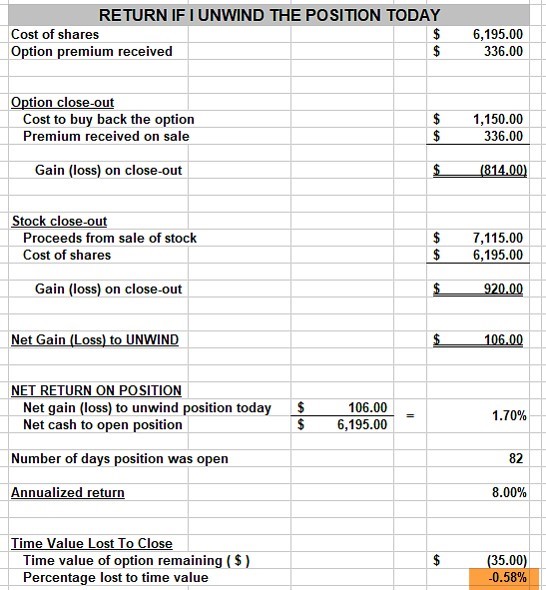
Unwind calculations if both legs of the position are closed on 10/6/2020

Unwind calculations if both legs of the position are closed on 10/6/2020


The time-value cost-to-close (CTC) is 0.58%. There are 10 days remaining to contract expiration. We ask ourselves: Can we generate at least 1% more than the time-value CTC or 1.58% or more with a different security by 10/16/2020? If yes, we execute the mid-contract unwind exit strategy. If no or unsure, we take no action and continue to monitor the trade with possible rolling opportunities as expiration approaches.

Discussion

Exit strategy opportunities must be executed when beneficial to our overall portfolio success. To make these determinations, the BCI Calculators will assist as the formulas are built in to allow us to understand the mathematics of our trades. In the case of Alex’s TAN trade, a successful trade was executed with the possibility of establishing a second income stream in the same contract month with the same cash investment. 


ஞாயிறு, 18 ஏப்ரல், 2021

Determine Stock Market Bottoms - IBD time the market

 When the market is in a correction, how do you know when that trend has changed and it's time to buy stocks again?

Wait for a "follow-through day."

IBD's ongoing study of every market cycle since 1880 has found that no bull market has ever started without a follow-through day. So instead of relying on hunches or predictions, wait for this time-tested signal to confirm the market has hit bottom and a new uptrend has begun.

Key Elements of a Follow-Through:

  • New Low
    • When the market is in a downtrend, look for at least one of the major indexes (mainly the S&P 500 or Nasdaq Composite) to hit a new price low.
  • Attempted Rally
    • After hitting a new low, look for a day when the index closes higher. That might mean the index has stopped its decline, established a new "bottom," and is on its way to a rebound.
    • But one up day isn't enough to tell if the market trend has truly changed. So we count that as Day 1 of an attempted rally.
    • From there, as long as the index stays above the previous low, the attempted rally remains in place.
  • Follow-Through Day: Big Gain in Rising Volume
    • A follow-through day indicates the attempted rally has succeeded.
    • To count as a follow-through day, at least one major index needs to close up 1.25% or higher in volume heavier than the prior day. Volume does NOT have to be above average; just higher than the prior day.
    • Follow-throughs typically occur anytime from Day 4 or later in the attempted rally. They can happen as early as Day 3, but the first three days are usually too soon to confirm a new uptrend.

Get Back in Gradually After a Follow-Through Day

Not every follow-through day leads to a big, sustained uptrend. About 25% - 30% will fail, and the market will quickly fall back into a correction. That's why you want to get back into the market gradually when a follow-through day occurs and the Market Pulse shifts from "Market in correction" to "Confirmed uptrend."

If the uptrend takes hold and leading CAN SLIM® stocks start to move higher on heavy buying by institutional investors, you can start to get in more aggressively. If the uptrend fails, follow your sell rules and move safely back to the sidelines.

Watch Out for Distribution Days

If you see distribution days within just a few days after the follow-through, look out! It could mean the nascent uptrend is not taking hold and will quickly fall back into a correction. Regularly check the Market Pulse for the current distribution day count and any alerts to changes in trend.

The Big Money is Made in the Early Stages of New Uptrends

As noted earlier, the biggest winners tend to launch new price runs right at the beginning of a new uptrend.

It's all part of the market cycle: During the prior correction, they form base patterns. Then they break out as the market direction changes, often on the actual follow-through day or within the next two — three weeks.

The examples below show how that same phenomenon happens year after year.


Option Earnings play - IBD

Why Use Options During Earnings Season

First, look for stocks at or near proper buy points. Most will be building bases. After that, look for a slightly out-of-the-money weekly or monthly call option. This means the strike price is just above the underlying stock price. Every strike price comes with a premium, or the cost of the option. Divide the premium by the stock price, and multiply by 100; this gives you the downside risk for the trade in percentage form. Looks for trades with downside risk of 4% or less.

The strategy is detailed every week in the Earnings Preview column of the IBD Weekly print edition, on page B2.

NVDA example 

One of the early winners since this feature's debut? Check out Nvidia (NVDA), featured in the May 9, 2016, edition of IBD Weekly as it got support at the 10-week moving average.

When shares were trading around 35.50 on May 12, a slightly out-of-the-money weekly call option with a 36 strike price (May 13 expiration) came with a premium of $1.27. That offered a trade with 3.6% downside risk.

Shares gapped up May 13 on earnings and closed at 40.98. The option could have been exercised that day at 36. If you didn't want shares, you could have sold the option itself for a nice profit.

Other winners that arrived in later weeks included Salesforce.com (CRM), Ulta Beauty (ULTA), Lululemon (LULU), Paychex (PAYX), Yum Brands (YUM) and Domino's.

Of course, earnings option plays aren't always going to work, but they're a lower-risk alternative to buying a stock outright ahead of earnings because risk is predefined.

Wells Fargo Stock Earnings Next Week; Options Market Helps Set Expectations

Calculating Expected Move On Wells Fargo Stock

The quickest way to work out the expected move is to look up the option chain and add together the price of the at-the-money put option and the at-the-money call option. We use the first expiration date after the earnings date.

While this approach isn't as accurate as a detailed calculation, it does serve as a reasonable estimate.

Let's take Wells Fargo stock as an example. Earnings are before the open on July 14 so we would use the option chain with a July 16 expiration. The at-the-money call and at-the-money put on Wells Fargo stock are trading just above and below 1.00. The sum of both is roughly 2.05 and that is the expected point move. With Wells Fargo stock trading around 42.50, that's about a 4.8% expected move.

Remember, that doesn't tell you direction. It could be either up or down!


வியாழன், 15 ஏப்ரல், 2021

Scott Welsh strategies

 Bollinger Band strategy.

1. 80 length (SMA) and 1 Std deviation on 4 hour time frame.

buy (Long) on next day if price breaks out upper BB. Sell if price breaks lower BB.

2. 100 length (SMA) and 3 Std deviation on 1 hour time frame.

buy (Long) on next day if price breaks out upper BB. Sell if price breaks lower BB.

3. 20 length (SMA) and 2.3 Std deviation on 4 hour time frame.

buy (Long) on next day if price breaks out upper BB. Sell if price breaks lower BB.

Images for forex but it will work for stocks.


4 Hour chart length 80 1 std Div

1 Hour 100 length 3 Std.Div


-

சனி, 3 ஏப்ரல், 2021

How to Time the Bottom in Stocks


How to Time the Bottom in Stocks: A Three-Step Trading Method

Rule - 

Candle color is not a matter/issue.

  1. Weekly chart must undercut previous 3 weeks.
  2. Chart must close above prior weeks close.
  3. Must have above average volume on point 2 candle.

Money management rules for stock trades.

  • Enter at open on Monday using market order.
  • Sell half at 8% (Target 1)
  • Stop- loss max 10%
  • Once hits Target 1, raise SL to break even on remaining shares.
  • Trail 1% behind 50SMA on remaining shares. 

Candle color is not an issue.
Red, Green, Red. Picture 1
Red, Red, Red Picture 2, 3
Chances are high for the stock to go up if green candle is bigger than 3rd red candle (engulfing candle) 


சனி, 20 மார்ச், 2021

EZ Breakout

How to find Market TOP?

5 distribution days happened in 3 week period. . Market closes lower on heavier volume than previous day. Market means SP500 and Nasdaq.

How to find Market Bottom?

2 events leads to it.

After market trades down it starts to go up. That low point is considered as market bottom. After market bottom we have to see Follow Trough days on 4th day or later. But before 10th day.

Event 1:

Day 1 of the 'day count' is the first day that either: market touches its lowest point and closes upper half of its range.  OR the 1st 'up' day after market touches its lowest point and closes lower half of its range.

Event 2:

Once day 1 occurs and the low is in place we are looking something called as "Follow-Through" day

Follow-Through day 

When 1 of the indexes (DJIA, COMP or SP500) closes up 1.25%+ on higher volume than previous day

It happens somewhere on day 4 or later (It does not count if it happens on day 2 or 3 )

The most powerful Follow Through can happen after day 10 but they are rare and usually not as powerful.

This methodology signals the market bottom about 80% of the time and the market has never bottomed without a Follow Through day.

Follow-Through days that have staying power tend to have a lot of stocks ready to lead the charge and ready to  breakout. This was not the case initially, but now many more stocks are setting up and breaking out.

If one of the indexes suffers a distribution day (a decline in higher volume) soon after the follow through, its often a sign that  the follow through will fail.

Follow through days tend to fail more often after the indexes have fallen sharply over a short period of time  while slicing their 50 day and /or 200 day moving averages (like in Feb 2020)

A close below the low of the follow through day also signals likely failure.


Market Top


When is market  bottom will happened?? nobody knows that. After market goes down 20 or 30 or 40% 


How to fix a stock if price goes down from buy point. 
for example after earnings or some bad news.
Buy one ITM call and sell 2 OTM call.
Ex. Bought AAPL at 133  now it is 123.99 how to fix it?
Buy 1  120 call at 9.95 and 
sell 2 130 call at 5.25 (9.95 - 10.50) we used sell premium to buy a call.
so now avg price of AAPL is 126.5


Swing trade.

  1. 6% protective stop from buy price.
  2. if Daily RSI close above 86 sell next day.
  3. No matter what sell on 7th day if any of the above conditions don't met.


IBD information to Buy to Sell etc

 எhttps://www.investors.com/how-to-invest/when-to-sell-stocks/   When to sell stocks. https://www.investors.com/how-to-invest/how-to-buy-sto...