சனி, 1 பிப்ரவரி, 2020

Meta stock -

12/11/19

If you don't test it Don't trade it.
Many strategies are vague and subject to interpretation in order to make them difficult to impossible test
don't victim of that trap.
ex copper ( RIO, COPX, BHP, FCX, SCCO )

Knoxville Divergence 
He used Momentum Indicator and relative strength index (RSI)
if price goes down but momentum goes up that creates divergence.

MEM research - Mary Ellen McGonagle 
How to increase returns using Growth and Income 

Key ways to uncover top candidates 
  • Industry group of stock is outperforming markets. 
  • Growth prospects are promising.
  • Stocks has sound reason for doing well.
  • Institutions are involved in stock.
  • Economic backdrop supports a continued moved higher.
How to pinpoint Entry and Exit points.
  • Stock pulls back to key MA. (High moving stock pulls back to key MA) - Entry 
  • Volume then picks up as it moves away from MAV - Entry
  • Stock breaks out of or forms right side of base. - Entry
  • Stock drops below key  support on volume while broader market go higher. (not good sign so Exit)
AVGO, SBX are growth stocks. MCD is yield stock.
Dividend Aristocrat stocks.- steady Grower (THOSE STOCKS ARE LISTED IN WIKIPEDIA under Dividend Aristocrat)
CTAS

Thank you for attending Trading Call Options in MetaStock 17 for Substantial Gains 01/29/20


Trader summit February 2020 -  2/17/20
Doji rule
Price will move inn the direction of how price opens after Doji
Top Ranked signals

  1. Your best friend -It is Doji  (Doji followed by gap and Doji appear in oversold area of stochastic. )
  2. Left/Right combo
  3. Series of doji
  4. Candlestick signal followed by gap ups
  5. Kicker signal
  6. Bullish Flutter kicker
  7. Inverted Hammer
  8. Magnitude of signal
Bearish best friend.
Doji gaps down in over bought area.
Left/Right combo - left is Doji Right is Big candle stick, if it is white and appears in oversold area price go up. Left is doji and Right is red candle stick and it appears in overbought area and crossed  T-line then it is bearish signal.
Bullish Doji sandwich - Bullish candle then Doji on top of that candle then Bullish candle on top of doji. Both candle looks same size and 2nd candle is above T-line. Expectation is more up side.

Prime trade select - Chuck Hughes
Purchase stocks or CALL on buy signal.
Purchase PUT or inverse ETF on sell signal.

Step-1
EMA Trend System Rules

A Stock is on EMA 'buy' signal when the 50-day EMA is above 100-day EMA

A Stock is on EMA 'sell' signal when the 50-day EMA is below 100-day EMA

Step-2
use Keltner channel to find Lower risk entry points for stocks and options.

Stocks normally trade inside channel. when it goes above channel it is getting over bought and normally trades lower (circled)


Notice the Subsequent price declines when HD stock trades above upper channel.


When a stock trades below upper channel it is in a Keltner "Buy Zone" and the stock or call option can be purchased.

Step-3
Use the '1% rule' to select an option strike price with higher percentage of winning trades

How do you determine which strike price to trade?
-Selecting a strike price can be just as important as the stock selection itself.

-Option premiums consist of time value and intrinsic value.
time + intrinsic = option premium 


Each day before option expiration, the time value portion of an option decays. 

The greatest amount of the time decay occurs in the last 30 days before option expiration. 

Time value <1% of stock price.
The stock price needs to increase 1% in order for the opti0n trade to start profiting.

When you use 1% rule, the option intrinsic value willl increase 100 for each 1 point increase in the underlying stock.

for ex-
XLU current price 54.36
strike price 40
Intersic value = 14.36 (54.36-40)
time as per 1% rule = .54

Option premium = 14.80
Intersinc value = 14.36
so time value is .44 (14.80 - 14.36)

.44 is less than 1% of the 54.36 ( .54) stock price so this strike price qualifies under 1% rule.

in this example XLU only needs to increase .44 for the trade to break even and start profiting.

A 1% price increase to profit has a much higher probability of being profitable than an at-the-money or out-of-the money strike price that can require up to a 5 to 10% or greater price increase option expiration to profit.

Many times the expected stock price move will not occur before option expiration.

OPTIONSTRATEGISTdotCOM -McMILLIAN ANALYSIS CORP


 Asia Online Traders Summit  FEB 22-20


Online Traders Summit - March 21, 2020

Strong breaks result in large moves


வெள்ளி, 31 ஜனவரி, 2020

Tiger trade 2020

January Festival of Traders 01-08-20
STEP-1
Buy if stock is above 50SMA (so it is up trend) if 3-5 bars are above 50SMA then it is over all uptrend, so instead of 1 bar wait  for 3 bar.
Short if stock is below 50SMA below 50 SMA means down trend. If 3-5 bars are below 50SMA then it is over all trend is down, so instead of 1 bar wait  for 3 bar.

STEP-2
if candle stick is in 50SMA if top 25% of candle stick is above 50SMA buy, same way if bottom 25% is above 50SMA short.


KJTRADINGSYSTEMS.COM

The Path To Consistency Starts With This Tool! With Steve Primo


BUY SET UP
Green bar closes BELOW previous green bars low. 
Momentum/trend is up so 2nd green bar shows green filled color. Normally green filled bar is red per western standard. 
SELL SET UP.
Red bar closes ABOVE previous red bar's high.
Momentum/trend is down so  red fill and red outline. 


Learn to Trade Big Pullbacks with the RSI2 Strategy 01/09/20


CLOSE means price 20-120, MA below 2000 volume 500000
.
Strategy -1 Buy and Short many stocks at market close.
Strategy 2 - Divergence 
Strategy 3 - Pull back.. in nice perfect  trending stocks RSI reaches 2 that is point for pull back end. There make sure green bar goes above red bar otherwise don't trade (no pull back end)

How to Trade Momentum: RSI Power Zones Setups in Today's Markets 01/12/20
RSI Bear zone -
Support zone 20-30
Resistance zone - 55-65
RSI Bull zone - 
Support zone 40-50
Resistance zone - 80-90


Backtested entries video, trade a naked chart, and breakouts (Three Fantastic Algo Trading Entries That Work in 2020) - 1/31/20
Mistake 1 -
Most traders focus only on entries
Bad bad  BAD
You need to take entry and then properly develop strategy
Mistake #2
Most traders never test entries.
Mistake #3
Most people test strategies incorrectly

9 TERRIFIC TRADING ENTRIES
ENTRY AND EXIT CONFESSIONS OF CHAMPION TRADER-
both are KELVIN J DAVEY books


ENTRY#1: (confession book entry 38)
simple. daily bars(candles)
Tested over limited period.

if it gives profit over most iterations may be it is good strategy and worth further investigation.

ENTRY #2(free book entry 4)
daily GOLD bars
Initial test over 2 yrs.
if itt gives profit over most iterations may be it is good strategy

ENTRY #3 (free book entry 3)
SIMPLE
240min bars mini S&P
Initial test over 2 yrs.
if it gives profit over most iterations may be it is good strategy


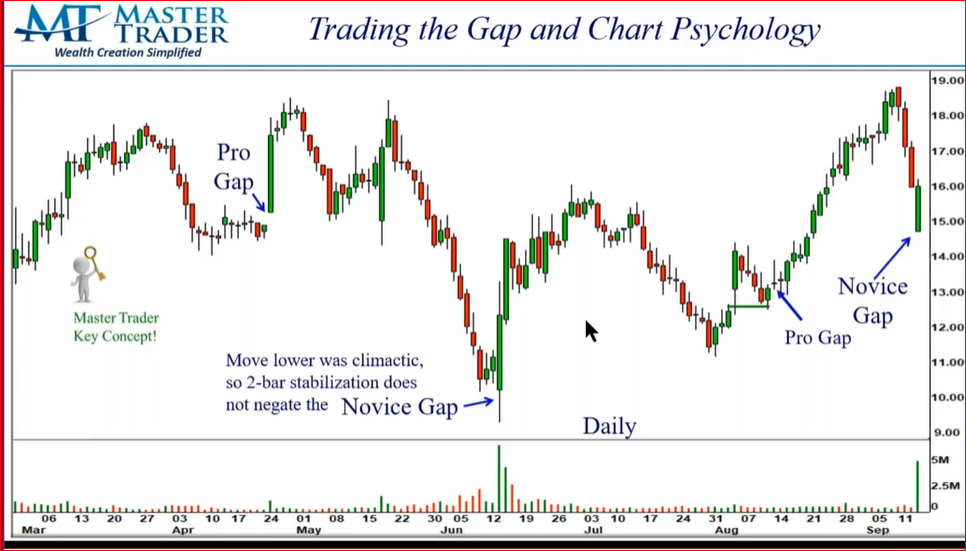
How to Create a Morning Gap Trading Plan with Chart Psychology 01/25/20
BOF - break out failure
TT - Top Trailing


Getting into New Trends Early by Trading Bowtie Patterns and First Thrusts 02/18/20

if Price shoots up from multi year low or all time low then pull backs 2 or 3 ticks then raise again. Buy in pull back.
** Major low or at least lower high

BOW-TIE RULES
1. After a Major low the moving average must go from downward proper order 10SMA < 20 EMA < 30 EMA. To uptrend proper order 10SMA > 20 EMA > 30 EMA over a short period of time, ideally 3-4 days of period.
2. Stock (or other market) must have (at-least) a 1-bar pull back
3. Go long above (2).


All major Tops and Bottom have traditional pattern (Bowtie, First thrust...)
Pay careful attention to Weekly signals.
Discover the Exact Four Strategies for Making Consistent Investment Income - FEB 15, 2020


$4.80 GE 15Jan21 $5 Call Buy-to-open
$0.30 GE 20Sep019 $10.00 Call Sell-to-open

Instant dividend 30.00 per option contract sold.

if GE closes above $10 on september 20...

$4.80 GE 15Jan21 $5 Call Buy-to-open (we execute)
$5.00 GE 15Jan21 $5 Call called out. (we have to sell)
--------
$0.20 Break even

$0.30 GE 20Sep019 $10.00 Call Sell-to-open

$0.50 Total Profit


Finding Meaningful Tops and Bottoms in Five Easy Steps 02/29/20
Why 60 bars (3 months)? 3 months works better than others.
Below Pic - Price goes down but momentum goes up


Find lowest intraday low in 60 bars (3 months) it is A. B is corresponding momentum. Find lowest momentum point is 60 bars that is point C. corresponding price is point D. Then find highest momentum point between point B & C inclusive of these 2 points., that is E. draw horizontal line from E. when ever momentum moves higher than line, mark that is a ENTRY point alas Trigger point. 


PROFIT /TARGET
Target 1 -  50% range D-A
Target 2- 100%  50% range D-A
Target 3- 200%  50% range D-A
or 2% futures, 5% stock 3MA rule. 
 , 
setup used Momentum.  MACD, CCIalso used
Learn How to Anticipate Market Movements with Fibonacci 02/23/202
Fibonacci Analysis

 Step -01


Step-02

Step -3


Step -4


Step-5


IBD information to Buy to Sell etc

 எhttps://www.investors.com/how-to-invest/when-to-sell-stocks/   When to sell stocks. https://www.investors.com/how-to-invest/how-to-buy-sto...