Divergence indicator
A strategy for consistent profit
the
best performing indicators for trading etfs.
market
insights for trading success
the
essence of swing trading
how
to screen for top candidate stocks
.
how
to combine 3 market indicators and 1 killer strategy to win over 80%
of the time while paying zero attention to your trades
HOW
TO AVOID MARKET CHOPPY MARKETS
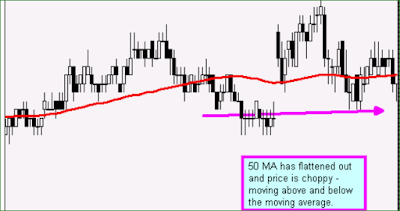
CONSOLIDATION SIGNAL #1: FLAT 50 SIMPLE MOVING AVERAGE
The teacher of my very first Futures course taught me this. He said as simple as it is, it would be the best thing anyone ever taught me.
When the 50 simple moving average if FLAT, that means the market is flat, and that means your position should be flat!
“If it’s flat, be flat, it’s as simple as that!”
Below is a 2 minute chart of the S&P emini. You can see that when the 50 MA (the red line) goes flat, it’s a clear indication that there is no trend in the market.
The 50 MA will have to be flat for a few bars when the trend is changing. Therefore this rule only applies when it has been flat for an entire cycle (use your favorite oscillator for measuring cycles).
CONSOLIDATION SIGNAL #2: USE TICK CHARTS
Most people use time charts, meaning that each new bar is created after a certain period of time: 2 minutes, 5 minutes, 1 day, etc.
“Tick” charts are charts that create a new bar after a certain number of TRADES are executed. A 100 tick chart starts a new bar whenever 100 trades go through and the 101st trade comes in.
During consolidation, volume tends to drop. Minute charts will continue to form new bars every minute, thus giving you long periods of consolidation on your chart and creating price patterns and indicator patterns you may be tempted to trade.
Tick charts, however, print fewer bars during periods of low volume consolidation because they only print new bars when the designated number of trades are executed through the exchange. Therefore you don’t see as much consolidation on your chart, thus removing some false signals and some temptation!
Below is a comparison of the exact same 2 hour period as it looks on a 2 minute chart and a 500 tick chart of the eminis.


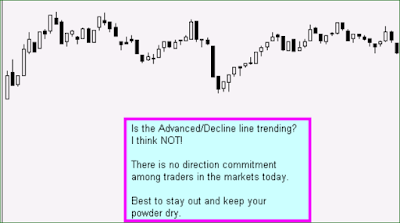
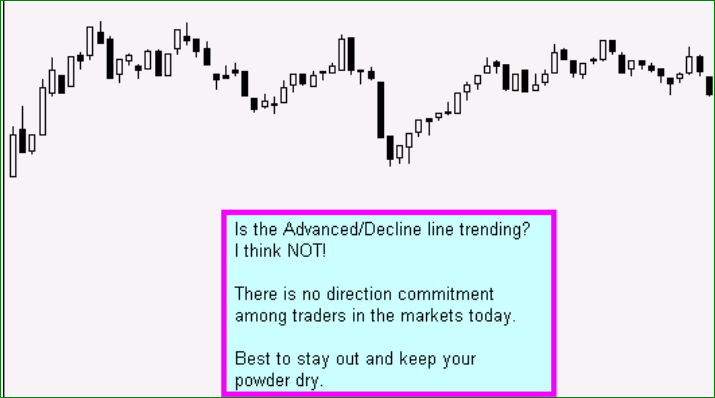
CONSOLIDATION SIGNAL #3: FLAT ADVANCE/DECLINE LINE
One of the indicators you should always be watching, in my never-to-be-humble opinion, is the Advance/Decline line.
This is the difference between the Advancing and Declining issues. There’s one measurement for the NYSE and another for the NASDAQ.
Use whichever one (or both) that relates to the market(s) you trade.
The bottom line on this indicator is simple. Much like the 50 MA, when it goes flat, keep your account flat. It’s an indication that there is no clear direction in the market.

So the market may be trending, but if the Adv/Dec is flat, your “trending” market could change direction or simply go flat at any moment.
For day trading I use a 2 minute chart of the Advance/Decline line.
When I say “flat,” that is a relative term, as it is with the 50 MA. With the 50 MA I’m looking at the angle of the line, but with Adv/Dec I’m plotting price bars and looking for a clear trend of higher highs/ and higher lows.

CONSOLIDATION SIGNAL #4: FLAT UP/DOWN VOLUME
Here’s another one of my favorites, and I don’t know many people who use this. Hint: that’s called an “edge” for you and me!
It’s the up/down volume. It measures the difference between the up volume and the down volume, as opposed to the difference between the number of issues up verses down. Again, it’s available for both the NYSE and the NASDAQ.
The key is to watch the relationship of the bars to the zero line (I draw it in as a horizontal line on my chart).
If the bars simply hover around the zero line, that’s an indication that there isn’t any strong commitment of traders in either direction today, and therefore you may have a choppy, trendless market or a trend that is in place is less likely to continue following through.
Sometimes the Advance/Decline line will be trending, but if the Up/Down Volume is not trending, then be careful! There may be more issues going up than down, but there isn’t volume to support the move!

CONSOLIDATION SIGNAL #5: INTER-MARKET BIFURCATION
The final sign of a potentially choppy market is when the major indices get out of alignment.
If you’re trading the DOW, or a DOW stock, and it’s trending up nicely, but the NASDAQ is negative for the day, the NASDAQ may have a negative pull on the DOW and hinder its ability to continue trending.
You want to watch to see if the markets are splitting any of the following levels:
Yesterday’s Close.
50 MA
Central Pivot
“Splitting” any of these 3 levels, means that one of the four markets is above and another is below.
For example, if the S&P is above its close from yesterday, but the NASDAQ is below its close from yesterday, then the overall market condition would be considered “bifurcated.”
Another example: If the DOW is above its Central Pivot, but the S&P is below its Central Pivot, then the overall market condition is considered “bifurcated.”
Although one market will always be stronger than another market, the strongest trending days usually occur when all 4 of these markets are clearly bullish or bearish. When the markets all move together, they move more freely and tend to follow-through more … sometimes trending in one direction for the entire day.
I like to have a quote screen with the following markets at the top:
S&P Russell DOW NASDAQ NDX ES ER2 (or AB) YM NQ
On the quote screen I include a column for “Net Change” from yesterday’s close. This allows me to see in an instant if the markets are aligned with yesterday’s close.
If they’re all red, then they’re all below yesterday’s close.
If they’re all green, then they’re all above yesterday’s close.
If some are red and some are green, then the markets are bifurcated.
In the quote window below, all the markets are aligned to the downside, with all of them below their respective “yesterday’s lows” for both Cash and Futures.

The teacher of my very first Futures course taught me this. He said as simple as it is, it would be the best thing anyone ever taught me.
When the 50 simple moving average if FLAT, that means the market is flat, and that means your position should be flat!
“If it’s flat, be flat, it’s as simple as that!”
Below is a 2 minute chart of the S&P emini. You can see that when the 50 MA (the red line) goes flat, it’s a clear indication that there is no trend in the market.
The 50 MA will have to be flat for a few bars when the trend is changing. Therefore this rule only applies when it has been flat for an entire cycle (use your favorite oscillator for measuring cycles).

CONSOLIDATION SIGNAL #2: USE TICK CHARTS
Most people use time charts, meaning that each new bar is created after a certain period of time: 2 minutes, 5 minutes, 1 day, etc.
“Tick” charts are charts that create a new bar after a certain number of TRADES are executed. A 100 tick chart starts a new bar whenever 100 trades go through and the 101st trade comes in.
During consolidation, volume tends to drop. Minute charts will continue to form new bars every minute, thus giving you long periods of consolidation on your chart and creating price patterns and indicator patterns you may be tempted to trade.
Tick charts, however, print fewer bars during periods of low volume consolidation because they only print new bars when the designated number of trades are executed through the exchange. Therefore you don’t see as much consolidation on your chart, thus removing some false signals and some temptation!
Below is a comparison of the exact same 2 hour period as it looks on a 2 minute chart and a 500 tick chart of the eminis.


CONSOLIDATION SIGNAL #3: FLAT ADVANCE/DECLINE LINE
One of the indicators you should always be watching, in my never-to-be-humble opinion, is the Advance/Decline line.
This is the difference between the Advancing and Declining issues. There’s one measurement for the NYSE and another for the NASDAQ.
Use whichever one (or both) that relates to the market(s) you trade.
The bottom line on this indicator is simple. Much like the 50 MA, when it goes flat, keep your account flat. It’s an indication that there is no clear direction in the market.

So the market may be trending, but if the Adv/Dec is flat, your “trending” market could change direction or simply go flat at any moment.
For day trading I use a 2 minute chart of the Advance/Decline line.
When I say “flat,” that is a relative term, as it is with the 50 MA. With the 50 MA I’m looking at the angle of the line, but with Adv/Dec I’m plotting price bars and looking for a clear trend of higher highs/ and higher lows.

CONSOLIDATION SIGNAL #4: FLAT UP/DOWN VOLUME
Here’s another one of my favorites, and I don’t know many people who use this. Hint: that’s called an “edge” for you and me!
It’s the up/down volume. It measures the difference between the up volume and the down volume, as opposed to the difference between the number of issues up verses down. Again, it’s available for both the NYSE and the NASDAQ.
The key is to watch the relationship of the bars to the zero line (I draw it in as a horizontal line on my chart).
If the bars simply hover around the zero line, that’s an indication that there isn’t any strong commitment of traders in either direction today, and therefore you may have a choppy, trendless market or a trend that is in place is less likely to continue following through.
Sometimes the Advance/Decline line will be trending, but if the Up/Down Volume is not trending, then be careful! There may be more issues going up than down, but there isn’t volume to support the move!

CONSOLIDATION SIGNAL #5: INTER-MARKET BIFURCATION
The final sign of a potentially choppy market is when the major indices get out of alignment.
If you’re trading the DOW, or a DOW stock, and it’s trending up nicely, but the NASDAQ is negative for the day, the NASDAQ may have a negative pull on the DOW and hinder its ability to continue trending.
You want to watch to see if the markets are splitting any of the following levels:
Yesterday’s Close.
50 MA
Central Pivot
“Splitting” any of these 3 levels, means that one of the four markets is above and another is below.
For example, if the S&P is above its close from yesterday, but the NASDAQ is below its close from yesterday, then the overall market condition would be considered “bifurcated.”
Another example: If the DOW is above its Central Pivot, but the S&P is below its Central Pivot, then the overall market condition is considered “bifurcated.”
Although one market will always be stronger than another market, the strongest trending days usually occur when all 4 of these markets are clearly bullish or bearish. When the markets all move together, they move more freely and tend to follow-through more … sometimes trending in one direction for the entire day.
I like to have a quote screen with the following markets at the top:
S&P Russell DOW NASDAQ NDX ES ER2 (or AB) YM NQ
On the quote screen I include a column for “Net Change” from yesterday’s close. This allows me to see in an instant if the markets are aligned with yesterday’s close.
If they’re all red, then they’re all below yesterday’s close.
If they’re all green, then they’re all above yesterday’s close.
If some are red and some are green, then the markets are bifurcated.
In the quote window below, all the markets are aligned to the downside, with all of them below their respective “yesterday’s lows” for both Cash and Futures.

DIVERGENCE INDICATOR
Price is coming down
Momentum(21) is going up RSI(21) is going up is conformation.
Embrace Simple Charts
Price is king! New and struggling traders often make the mistake of overcrowding charts with indicators. Many traders fall into the trap of believing that indicators give you the power to predict future price action. While indicators can provide useful clues, it’s wrong to think they have the power to predict all the possible outcomes. I recommend using a chart cleared of all indicators and a white background with black and white candles. The human eye is much more receptive to black and white images.
One Indicator for Easy Entries
by adding just one indicator called Volatility Stop Indicator on my TC2000 Platform. It is an Average True Range indicator with these settings. True Range Period = 10, True Range Multiplier = 1.50. At the end of this book, I will provide links to setting up the indicator in TC2000 as well as on thinkorswim charts. Please feel free to reverse engineer it for any charting platform you use.
First, please understand there is nothing magic about this indicator. Price is still, and will always be, a top priority. I am an unapologetically conservative trader. I am also very selective about the charts and the trades that I take. In my opinion, Quality is far more important than Quantity especially if you want to improve your win/loss ratio and consistently profit.

The potential entries marked on the chart are near price support levels allowing for tight stop-loss orders and low-risk trades.
The chart above is the same chart of Weight Watchers with the Volatility Stop Indicator turned on. The Red dots indicate price resistance and the Green dots mark price support. I recommend placing stop-loss orders just above the Red dots for a short trade and just below the Green dots for a long position. Notice the potential entries marked with the red circles are very close to where stop orders are located. This placement creates low-risk entries!
Simply follow when you see buyers reacting to price support. That means wait for the buy signal. No predicting, no guessing required! Once in the trade, manage the position by adjusting the stop at the end of the period you are trading (end of the day in this example).
Please note if you miss an entry, there is no need to chase it. As long as the stock remains in the trend, all you have to do is wait and prepare for the next low risk entry. Remember, we are looking for Quality over Quantity and don’t waste time with a stock that does not prove it’s worthy of your money.
You can now be in control, making the trades come to you! Follow the rules and this strategy is pretty hard to mess up.
Longer Term Traders
If you like longer term trades, take a look at the weekly chart. Again, easy to spot low-risk entries that can be held confidently for months. Just follow the price up as long as the trend continues.
Day Traders
Yes, it works just as well for those of you that prefer intraday trading. The 5-minute chart that is trending up, so all you have to do is wait for a low-risk entry and manage the trade by moving the stop at the end of each period.
If you have been struggling as a trader or want to improve your win/loss ratio, I have a suggestion for you. Having confidence in your trading system is very important. To create that confidence, it’s essential to be very selective about the trades you take. Remember, Quality over Quantity! To be selective, wait for the Volatility Stop to change from Red to Green. Once it is Green, evaluate the quality of the price action, trend, support and resistance that would be involved in the position. If the trade passes your rigorous evaluation, watch and wait for entry signals (buy signals) with stop-losses close at hand. In doing so, you have the benefit of seeing buyers reacting to support and you also have a low-risk trade if it fails. Always remember, there is no need to rush. Make the trade come to you!
WATCH LISTS
Building a qualified watchlist is much easier than you may think. First, we only want to look at stocks that fit with our account size. As an example let’s say you have a $20,000.00 trading account. Higher priced stocks would require too much of your account in a single trade. On the other hand, you may have rules to avoid very low-cost stocks or biotech companies due to their high volatility. To be efficient, screen out all stocks that don’t qualify.
Also we want to screen out all the stocks that don’t meet your volume requirements. Lastly, we only want to focus on stocks that are currently trending with the direction of the overall market. I do this using a 34EMA (exponential moving average) that has been trending at least 20 days. Manage your watch list daily. If a chart breaks the trend, remove it from the list and work to replace it with another trending stock.
Never Miss Another Trade
Avoid Temptation
Basic Rules
1. Always trade with the Direction of the Overall Market.
2. Only trade stocks moving with the Overall Market Direction.
3. Buy stocks that are AT or NEAR price support…with a buy signal.
4. Sell stocks that are AT or NEAR price resistance.
5. Never enter a trade without an exit plan.
6. Always know the exact amount of money at risk…acknowledge and accept this risk.
7. Make sure the potential Reward is greater than the Risk.
Do not trade if a single one of these rules is broken!
THE BEST PERFORMING INDICATORS FOR TRADING ETFS
1. Moving Average- The Market is a Dance of Moving Averages
The point where two moving averages meet is the point where you should execute your trades. Typically, go long once you see a MA of lower time frame “crossing over” a MA of higher time frame. It means that the stock/index/fund is in a positive momentum or is simply bullish. Take a short position if the reverse happens. Moving Averages, if used with right combinations, can predict the broad market trend accurately.
2. RSI – Locating the Greed and Fear.
RSI to go beyond 20/80 to be justified as oversold or overbought. It has to be combined with a trend indicator and candlestick patterns.
3. Fibonacci Retracement- What Goes Up, Must Come Down.
Bollinger bands are also used by swing traders to take advantage of sudden price movements. Since the price always tends to revert to the mean position after a sudden deviation, some traders immediately revert the Bollinger trend to make quick scalping trades.
In any trend, the momentum first increases and reaches a peak from where it collapses, taking the price of an ETF down to a certain level, before reverting to its original trend. Hence, this requires a specific stop loss, which is provided by the Fibonacci Retracement indicator. These pullbacks, which are known as retracements, are temporary and provide nice opportunities for quick traders to make profits in overbought/oversold conditions, and a chance for momentum traders to exploit the general trend.
4. Bollinger Bands: The Mean and the Two Deviations.
How to Use the Indications in Unison.
Indicators are like sticks, which can break if it stands alone but becomes powerful when many are bundled and used in unison. The chart we will be using is a recent 30-mins chart for Power Shares QQQ ETF, and we are going to follow the ETF for a week and look at points where we can enter profitable trades based on the indicators mentioned. The details of the indicators used in this trade are.
- Simple Moving Average- 20 days (red line), 50 days (green line) and 200 days (pink line).
- Bollinger Bands- 10 period.
- MACD- Short Period: 12, Long Period: 26 and EMA period: 9.
- RSI- 14 Period.
- Volume Moving Average- 5 Period
MARKET INSIGHTS FOR TRADING SUCCESS
The XLU Strategy is a long-term method of growing your account. It can bring you returns up to 3x as much as you would normally realize by using a simple buy and hold strategy.
Steps to the XLU Strategy:
Step 1: On Friday of the current week, buy XLU shares. You should buy an even 100 share allotment of XLU – meaning you can buy 100 shares, 200 shares, 500 shares, etc. On the Friday I’m writing this, XLU finished trading at 60.15. Buying 100 shares of XLU would cost you $6,015 before commissions and fees.
Step 2: Once you acquire the shares go look at the XLU option chain on your trading platform. Go to next Friday’s expiration date and find the strike between 0.25-0.50 above the current share price. For example, if you bought XLU at $60.15 on Friday August 2nd, you would find the $60.50 strike call option for Friday August 9th.
Step 3: With your shares now acquired and the correct option picked out, sell the equal amount of option contracts as the number of shares you have. If you have 100 shares of XLU, you will sell 1 contract. If you own 500 shares of XLU, you will sell 5 contracts. In this example, if the $60.5 strike option will pay us $0.25, we would collect $250 if we owned 1000 shares of XLU and sold 10 call options.
Step 4: Have patience, sit back and let the week play out.
Step 5: If XLU finishes below the strike price of the option, great! You get to keep the $250 of option premium you brought in from selling the covered call and you get to keep holding your shares. Right before the close, you will be able to buy back your call options at next to nothing and then go ahead and sell another covered call for the next Friday. If XLU finishes the week above your strike price, simply let your shares get called away. Then you can repurchase more shares and again sell the next Friday’s option.
Do not focus on the price of the option. If the price of XLU rises above your option strike, it will appear as if you are losing money on the option. That’s the incorrect way to think about it. By selling the $60.5 strike option for $0.25, you have decided you are willing to sell your shares at $60.5. If you bought XLU at $60.15 and sold at $60.5, you would net $0.35 per share of price appreciation over the week. But if you collected $0.25 per contract, you would net a total of $0.60 per share (0.35 + 0.25 = 0.60). That is a 1% gain in just one week for basically doing nothing. No market timing needed, and that is a good deal!
What it all adds up to over one year:
If you consistently did the XLU strategy throughout the course of one year, here is a rough estimate of what I would expect our total profit to be, and we will use a 1,000-share allotment for the example.
Assumption #1: On average you will bring in $0.25 per contract every week - 1,000 x $0.25 = $250
Over the course of 52 weeks – 52 x $250 = $13,000 collected from covered call premiums
Assumption #2: Estimate that you will be called away 10 times during the year at an average of $0.30 per shares when that occurs – 1,000 x $0.30 x 10 = $3,000 collected from capital gains when called away
Assumption #3: Historical returns for XLU are around 7.2% a year, so we will assume your 1,000 shares of XLU appreciates on average 0.14% a week (7.2% / 52 weeks). This is a bit tricky to estimate, but we will just base this appreciation off of 1000 shares of XLU at $60 initial price, appreciating roughly 0.14% a week for the 42 weeks we are not called away – 1000 x $60 x 0.14% x 42 weeks not called away = around $3,500 extra collected in capital gains per year
Total Estimated Return:
$13,000 in option premium collected from selling covered calls
+ $3,000 in capital gains when called away
+ $3,500 in capital gains from XLU price appreciation when not called away
+ $3,000 in capital gains when called away
+ $3,500 in capital gains from XLU price appreciation when not called away
= $19,500 profits on an average of $60,000 invested
or 32.5% return in one year of steady prices
Downside Risk:
I must also tell you that this is not a risk-free strategy, so we must prepare for the worst. What do you do if the price of XLU does not appreciate, but drops? How far would or should you let it drop before you changed your strategy? Here’s my opinion. Since the anticipated return of the XLU Covered Call Strategy over a 12-month time period of historical price trends is around 30%, I am willing to place an initial stop about 15% below entry price. This is equivalent to half of the anticipated 30% gain on the year. In our example, if we bought XLU at $60, the initial stop would go at $51 ($60 x 85% = $51), or $9 below our average cost. But remember, you can anticipate bringing in around $0.25 per contract every week you sell a covered call. If you never get called away, after 36 weeks of collecting premium ($9 / $0.25 = 36), you would essentially be risk-free, unless XLU gapped down more than 15% one morning (very unlikely).
Utility companies provide a product that the consumer cannot live without and price that product accordingly, so they turn a profit. Having said that, there are times when even utility stock prices fall. One such occasion is when we have a major shift in long-term growth of the economy. Think dotcom bust and financial crisis. Another situation would be if interest rates suddenly started rising substantially. Utility companies are heavy borrowers and rising interest rates would hurt profitability. But as the FED just lowered interest rates, we are clearly not in an environment of fast rising interest rates, and if price appreciates steadily, like utility stocks usually do, the XLU Covered Call Strategy is one of the most lucrative passive stock market investment strategies that I know of.
THE ESSENCE OF SWING TRADING
Simple Resistance/Support Lines
A clear resistance or support line can be immensely valuable for swing trading, but I stress, if used the correct way. I use such lines in two ways; 1) Leaning against them as resistance/support and 2) Breakouts
The key lies in understanding that resistance/support lines are not exact points but rather reference levels that need breathing room. In both charts below each time resistance was reached the stocks soon thereafter pulled back, thus respecting the resistance lines and for swing traders setting up juicy trades to the downside in this case. Ultimately both resistance lines were broken through to the upside with force, thus getting entirely disrespected/disregarded and for swing traders setting up trades to the long side.

Moving Averages
I use moving averages in much the same way that I use resistance/support and trend lines, with one big exception; moving averages work much better as reference points in trending markets.
Chart shows Apple Inc (AAPL) in a longer-standing uptrend from 2009 through 2011. Note that each time the stock moved down to AROUND the red line (200 day simple moving average), it proceeded to bounce and eventually move to higher highs. Netflix.com Inc (NFLX) and note how the 100 day simple moving average (blue line) held as support the entire way up, until it broke…which ushered in a big change of trend and ultimately a massive drop in the stock.
Momentum Oscillators
When it comes to momentum oscillators, the amount of variations out there is truly mind numbing. As such, I again prefer to keep it simple and for the majority of the time refer to the ‘Slow Stochatics’ indicator. While many traders sweat over overbought and oversold levels on this indicator, what I like to focus on is divergence between price and momentum. Over years of testing I found that as a stock’s price continues to rise but is not confirmed by rising momentum, strong swing trades to the short side eventually setup. Likewise on the long side, if price continues to fall but momentum starts coming out of oversold levels we have positive divergence and swing trades to the long side setup.
Trading Setups - The Rocket Launch
The rocket launch setup is a straight-forward and hugely rewarding trade. The setup focused on investor sentiment as displayed by visually strong price action just as weak hands sell the stock. At its core, the rocket launch setup is focused around a very strong price reversal being signaled by a hammer or engulfing candle. At the bottom of a trend, to signal a rocket launch setup the hammer or engulfing candle needs a follow-through buying day before the trade is valid. Follow-through buying should come within a handful of trading days of the signaling candle at the latest. Equally important is that momentum as measured by the Stochastic indicator is in oversold territory or preferably shows positive divergence, i.e. price is making a new low but momentum making a higher low. An automatic stop is assigned at the bottom of the signaling candle, helping you keep emotions out of the trade.
In February 2011 Williams Sonoma Inc (WSM) found support near $31.70 but failed to move much for a series of days. Finally on February 3rd the stock staged an outside day, followed by more buying the next day…which brought the buy signal end of day. Stochastics quickly came out of oversold and into overbought territory. The price action however rules as on the way up momentum can stay overbought for some time. Traders that spotted the rocket launch setup would have made a quick 5% - 10%, depending on what their time-frame was.

Sideways-Channel Breakouts
Over longer periods of time it is estimated that markets move in a consolidating sideways pattern roughly 80% of the time.
The sideways-channel breakout strategy is not only one of my favorite strategies but also one of the simplest ones to spot. The trick, as with most strategies lies in staying true to the execution plan. Typically, a sideways range trading channel should form such that price hits the top and bottom extreme of the channel at least once and preferably two or more times. At some point price will inevitably pierce out of the range (on a daily closing basis), which is the point we want to capture to enter the trade.
Focusing on daily charts, the sideways-channel breakout setup usually starts with a steep move up, followed with a horizontal consolidation period. Ideally the price action is such that the stock price touches both the upper and lower range of the channel several times (blue bubbles). The more often the lower and upper range get touched, the more vicious the breakout will eventually be. Often the stock creates a series of higher lows inside the channel that eventually leads to a breakout.
Entering the trade: Once price significantly pierces through the upper or bottom range (on a daily closing basis) we have an entry point. For me to enter a trade I like to see a daily close above/below the channel on good volume. Often a breakout will retrace all or parts of the initial move out of the channel before ultimately heading higher/lower yet. As such I place a stop a couple of percent inside the channel to ensure I don’t get stopped-out too easily. Patience is key in this trade as it is easy to take profits too early. Give other traders enough time to notice the breakout and let them chase it higher, allowing you to sell your position to them at an optimal price.
Trading Account Rules
If you trade/invest your own account, withdraw 50% of any trading profits at the end of each month and place into your checking account. This helps to keep emotions in check as the account grows. Never add money to a losing trading/investing account. Wait until profits are accruing again before committing any additional capital to the account.
Trade smaller , Only take the very high probability trades , Tighten stops , Absolutely stick to profit targets and stops. No exceptions!
HOW TO SCREEN FOR TOP CANDIDATE STOCKS


Looking strength among sectors.
Stocks pull back after 54% gain. buy this stock if it moves above 20 sma after pull back.

HOW TO COMBINE 3 MARKET INDICATORS AND 1 KILLER STRATEGY TO WIN OVER 80% OF THE TIME WHILE PAYING ZERO ATTENTION TO YOUR TRADES
Bollinger Bands
MACD
OBV


கருத்துகள் இல்லை:
கருத்துரையிடுக