T-LINE TRADING
T-Line trading is a flexible, reliable investing technique that will benefit most swing traders. I coined the term “T-Line” back when I was working as a moderator in a trading room in 2004. The T-Line is simply defined as the 8 EMA. Of course, I am not the first person to use the 8 EMA. I simply coined the term “T-Line” and came up with a trading plan that uses the 8 EMA as support (where there is buying pressure) and resistance (where there is selling pressure). Read on to learn more about this innovative strategy.
Background
Traders use many different moving averages as support and resistance. Some of the most commonly used moving averages are the 10 SMA, the 20 SMA, the 50 SMA, and the 200 SMA, but there are many others (21 EMA, 34 EMA, 72 EMA, 100 SMA, to name a few). Moving averages are lagging indicators, or technical indicators that trail the price action of an asset (which is kind of like a train laying down its own tracks). I personally use the T-Line, 20 SMA, 34 EMA, 50 SMA, and the 200 SMA. I encourage you to only use indicators that you use for your trading.
The Birth of T-Line Trading
So how did I first identify and use the T-Line? Well, after a long stretch of poor trading decisions and a decidedly losing strategy, I knew that I had to change something. That’s when I noticed that the T-Line connected the lows of a given time frame in an uptrend as well as the highs in a downtrend. I also realized that it acted as a trigger line or a trade line for entries and exits of a trade. After plotting the T-Line on my charts, I noticed that if a long stock closes above the T-Line, there was a high probability of a continued rise . The same is true in a downtrend—if a stock closes below the T-Line and remains below the T-Line, it will continue in the current downtrend. Thus, the T-Line was born!
Using T-Line Trading
The T-Line can be applied to all trading plans and investment strategies, and it operates in all time frames. I have found that it works best when trading the slower time frames (like the daily, weekly, and monthly charts) for the longer-term trader. The T-Line can work on 15-minute, 30-minute, and 60-minute charts as well (especially for the wing trader on the Daily), but it is not as reliable on the 1- or 5-minute charts.
Keeping all that in mind, T-Line trading is most beneficial to the swing trader. Long-term investors can use the T-Line, but investors typically aren’t getting in and out of trades as the price action goes up and down within a trend.
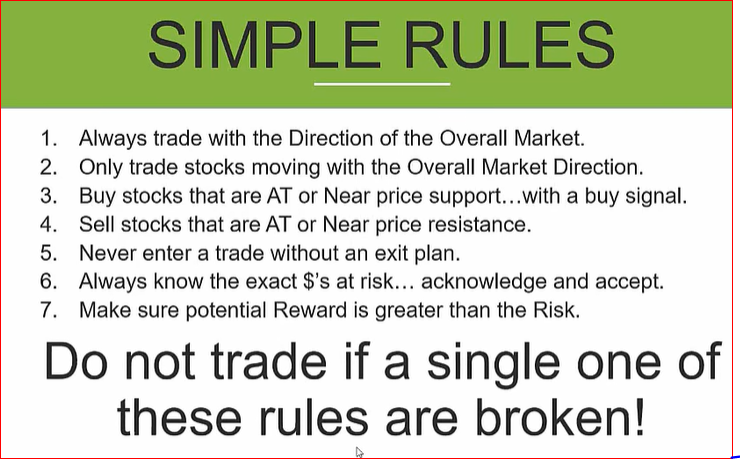
RULES
The simple rule of the t-line is that if you are in a long trade, you want the price action to close above the t-line to stay in the trade. The opposite is true with short trading. You want to stay short if the stock closes below the t-line. As with all signals and chart patterns, there needs to be confirmation or follow-through the following day. A key component to using the t-line correctly is to always get confirmation. On daily charts, confirmation comes when the following day's candle has fully formed. Confirmation is necessary with any chart time frame. If you trade the 4 hour chart, confirmation comes when the next 4 hour candle has fully formed, and so on.
Take the Reins
Wondering how T-Line trading will work with your investment strategies? Set the T-Line up on your charts and watch for yourself. Also, remember this basic rule: if you are in a long position, you want the price to close above the T-Line to stay in the trade. The opposite is true with short trading—you want to stay short if the stock closes below the T-Line.
Pretty simple, right? Give T-Line trading a try! It just might change the way you think about investing.
if T-line (8 EMA) turns upward that is entry. pull back over.
Price rising and crossing above 20-SMA or 34 EMA
In a trend
Profit taking / consolidation
Pullback to trend line / support
Indecisive price action pull back
Flag, Pennat, J-hooking in the making.


Like any other pattern failures occur, Trades (box or trend ) can last even for several months
BOX price is with in 3%.


Notice The gap up created an over bought condition with 3 EMA to far from the 8 EMA.
Rounded Bottom Breakout (RBB) https://www.youtube.com/watch?v=CvP9IBvkhbM
- The chart needs to be a downtrend, and the longer the downtrend, the better. The 20-day SMA is below the 34-day EMA, which is below the 50-day SMA, which is below the 200-day SMA. This is a clear downtrend.
- There should be a bottom formed, such that the chart is trading sideways, forms a double bottom, and has clearly reached its low. Then you want the price action to come above the 50-day SMA, thereby causing the 20-day SMA, the 34-day EMA, and the 50-day SMA to cross over to be on top of each other from being below each other.
- The actual trigger is when the stock price, the 20-day SMA and the 34-day EMA cross above the 50-day SMA. Usually, the price is first to close above the 50-day SMA.
- The breakout occurs when there is confirmation of a trend reversal, a price close above the 50-day simple moving average, and when the 20-day SMA and the 34-day EMA cross over the 50-day SMA.
- Ideally, you want the price action and the 50-day SMA to be at least 10% below the 200-day SMA. The larger the percentage below the 200 SMA, the greater the gain potential. This will occur in a solid downtrend.
- The main target in a rounded-bottom breakout is the 200-day simple moving average since that is likely the next resistance level. There may be a more compelling target, depending on the individual chart, but in most cases, the 200-day SMA is the best target. In a chart that is in a long-term downtrend, you may want to look for a lower target, such as strong resistance levels that occur before the 200-day SMA.
J-hook Pattern
Five Stages of the J-Hook Pattern
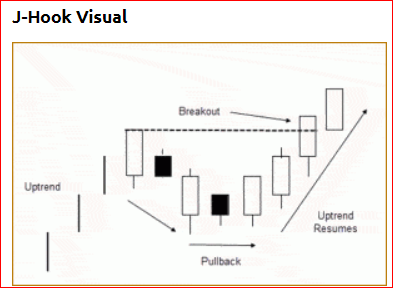
There are five stages to the J-Hook Pattern
- Price is moving higher in an uptrend fashion.
- Price pulls back and forms three or four candlesticks with lower highs.
- Price stops moving lower and finds support. There are usually two or more candlesticks the stay in the same price range and hold the lows.
- Price moves higher and resumes the uptrend. This looks like a series of candlesticks with higher lows.
- Price then breaks out to complete the J-Hook pattern. This is the first candlestick in the resumed uptrend to close above the high candlestick prior to the pullback.


V-Stop Indicator (volatility STOP)
Trend based indicator, shows stop location based on ATR Shows us trend and avg.volatility
Set-up
I feel 10 period 1.5 ATR works. yours may differ.
I use 3 month time frame
Shows Trend and average Volatility.
USES
It sees trend , support and resistance (flat lines), identifies Good entries, seeing here to move your stop.
It is not parabolic STOP (SAR)

I use 3 month time frame
Shows Trend and average Volatility.
USES
It sees trend , support and resistance (flat lines), identifies Good entries, seeing here to move your stop.
It is not parabolic STOP (SAR)


why good entry? gap between entry and stop is less, Bad entry? - gap, stop is large. Flat lines are good entry point.

Become a Better Trader - strategy
Day and Swing trade setup
Used Longer and shorter scholastic
s/r = support/resistance
use Fast scholastic for day trade. many people used 20 EMA.

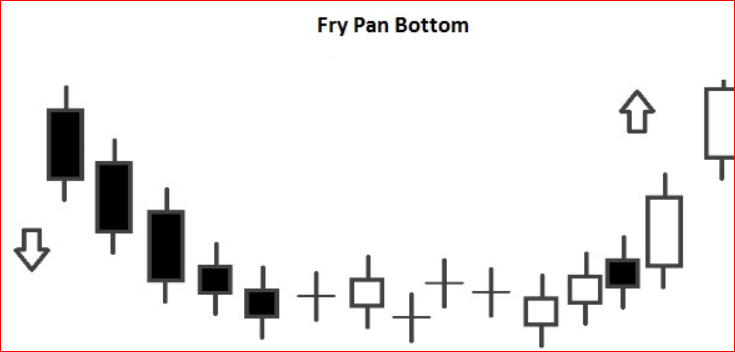
The Pattern starts during a Downtrend, then it becomes a “Sideways” Trend (That represents the indecision of the Markets); at the end of the Pattern, there is a reversal in the direction of the Trend and it becomes an Uptrend.
This Pattern is quite rare; is important that there is a Gap Up after the “Sideways” Trend and just before the start of the Uptrend (To obtain a further confirmation of the reversal of the Trend, as the Pattern suggests).
DUMPLING TOP
.

It occurs during an Uptrend; confirmation is required by the candles that follow the Pattern.
The Pattern starts during an Uptrend, then it becomes a “Sideways” Trend (That represents the indecision of the Markets); at the end of the Pattern, there is a reversal in the direction of the Trend and it becomes a Downtrend.
This Pattern is quite rare; is important that there is a Gap Up after the “Sideways” Trend and just before the start of the Uptrend (To obtain a further confirmation of the reversal of the Trend, as the Pattern suggests).
------------------------------------------------------------------------


கருத்துகள் இல்லை:
கருத்துரையிடுக