- Risk not more than 2% of your portfolio value.
- Limit total portfolio risk to 6%. in other words if you were stopped out on every position in your portfolio you would still retain 94% of te original trading capital.
- Be realistic about the amount of risk needed too make a profitable trade. don't MAKE a trade fir your risk parameters.
- Reward to RISK minimum of 2:1 preferable 3:1 or higher
- Lock in at-least a portion of a windfall profit. (sell few shares)
- Never add to or average down a losing position
- Be willing to stop trading and re-evaluate the markets and your methodology when you encounter a string of losses.

Left shows retail investors trading volume right shows in institutional investors trading volume. retail is 1, 3, 5 like But institutional is 10 30 50. look retail people are selling, institutional's are buying. . Retail is making mistake, institutions know better than retail. it shows stock will go up-. Now many brokers are showing trading volume. sizes are actual completed trade not just bidding.
Top Dog instruction
Stocks don't trend endlessly, Normally only 20% of time stocks trend. To get more profit you have to have or face more loosing trades and less winning trades, but loosing trades are small and winning trades are bigger than looser trades so net we get profit. . use 50 day SMA to find trend. if stock goes above we can say it is trending.

If it’s a reversal pattern, then you must have elements in the definition that make a reversal highly probable.

How to accurately identify a true head and shoulders pattern.

People think it’s supposed to be a reversal pattern but instead it works as a continuation as well. If it’s a reversal pattern, then you must have elements in the definition that make a reversal highly probable. There are nuances that can make it a very explosive pattern that produces fast profits.

The Rubber Band Trade is based on the “reversion to the mean” principle.

There are some very specific rules that will make this a very low risk trade and sometimes can even give you a good win/loss ratio.
50 SMA is center point if price goes below go for Long, price comes/touch to 50 SMA buy to cover, same way if price goes above go for Short, price comes/touches to 50 SMA sell.
if 50 SMA is down (angling down) (down trend) we go only for short, not go for Long even price goes above 50 SMA.


if trend is up go for long don't go for short.
if trend is down go for short, don't go for long.
if trend is flat go both.
Use stochastic oscillator to enter the trade.


Performance matrix
Accuracy or Win rate
Total winners/Total trades
Profit/Loss Ratio (reward/risk)
Average Profit / Average Loss
Risk Per Position
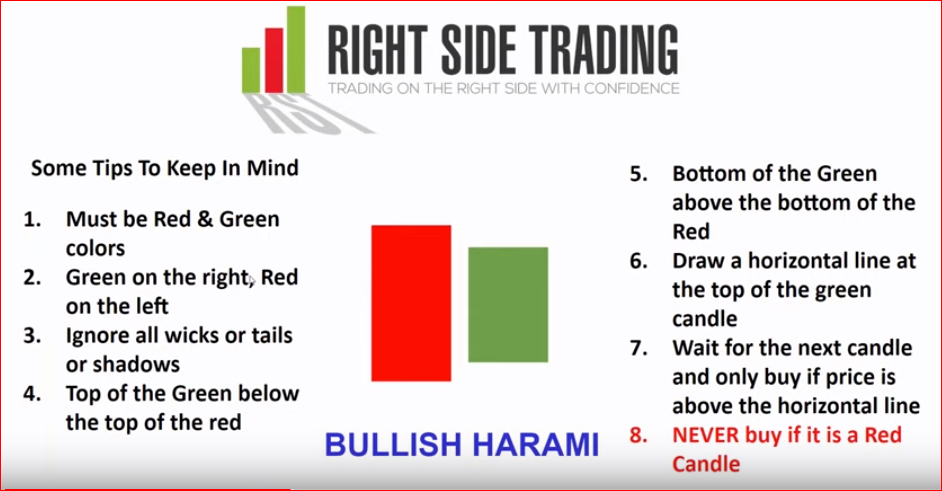
How to find next day green candle crosses Harami green candle and next day is red candle?
Next day look 15 minutes before close of market and buy/enter. Look 5 days whenever green candle crosses Harami green candle go for LONG/Buy.

If MACD and signal line is very close use MACD histogram to interpret the gap between MACD and signal line


Investor Expo Jan 23
Like aircraft pilot, Create Check list if all re ok then trade/Enter. - simpler trading.

4 KEYS to a create Bullish watch list
1. Sales Growth
2. EPS estimates revised upwards
3. Strong margins
4. Relative price strength
Create watch list in finviz (free)
Price, Volume
sales growth qtr over qtr
operating margin
Net profit margin
RSI( should be above 60).
go to zacks to find EPS estimates growth rank 1 means good, 2 next good.
IBD (Investor business daily) Market smith screener (Money)
Feb 20 Invester Expo


Feb 06 Investor Expo
High DELTA price change Big, % gain Small.
Low DELTA price change Small, % gain Big.
so prefer delta 0.10 to 0.45
STEALTH TRADE ACTIVITY
option price $.20 to 0.80
Delta 15 to 45
BUTTERFLY & LONG CONDOR
(what is )Delta neutral??


கருத்துகள் இல்லை:
கருத்துரையிடுக