சனி, 16 நவம்பர், 2019

TOP Dog உத்தி

பங்கை  வாங்கும் முன் கவனிக்கவேண்டியவை.

ஐந்து சக்தி உத்தி என்று இதை  அவர் குறிக்கிறார்.

  • போக்கு எப்படி இருக்கு என்று பார்க்கனும் (2 போக்கு காட்டிகள்) ADX, 14 Day EMA , 50 day SMA are trend indicators. போக்கு ஏறுமுகமாக இருக்கும் என்றால் நெடுக்கவும் இறங்குமுகமாக இருக்கும் என்றால் குறுக்கவும். பக்கவாட்டில் போனால் அப்பங்கை  தவிர்த்துவிடவும்.
  • உந்தம் எப்படி இருக்கு என்று பார்க்கனும் (2 உந்தம் காட்டிகள்) Stochatic slow, MACD and RSI
  • 3 அல்லது அதற்கு மேற்பட்ட வெவ்வேறு கால அளவு வரைபடம் எல்லாவற்றிலும் காட்டிகள் ஒரே திசையில் செல்ல வேண்டும்.
  • ஆதரவு-தடை கோடு தடை கோட்டுக்கு அருகில் வாங்க வேண்டாம்.
  • கோடு\வலையம் கீழேயிருந்து மேலே போகும் போது வாங்கவும்
மாற்றப்பட்ட Momentum indicator Stochastic slow values are  K=5 D=3 Smooth=2

 Steve Bigalow uses 12, 3, 3 


3 Keys concepts to consistent trading 


3 Hidden Elements of Market Geometry

Element 1: Waves

Wave 1: Typically the shortest of all the waves. We generally won’t know that it’s wave 1 until it’s followed by a corrective wave that does not break the starting point of wave 1.

Wave 2: A Corrective Wave that tends to move in an overlapping fashion (corrective waves will be studied in detail later), and does not go lower than the origin of wave 1 before moving up again, creating a higher low in this example.

Wave 3: Is what we call an Impulse Wave, as this wave’s magnitude is always larger than wave 1. The impulse wave also tends to have a steeper angle of ascent than wave 1. **If you look closely at the 5 wave structures, even the smaller sub structures, you will notice that wave 3 is always the longest. This is a very important characteristic to take
note of.

Wave 4: Another Corrective Wave, and this wave should never retrace lower than the high of wave 1. If wave 4 was to go lower than the high of wave 1, it will provide us with a sign that the previous wave structure was in fact not a trend, but probably some sort of correction instead!

Wave 5: Will generally break the high of wave 3 in another 5 smaller waves, and is generally the same measured length as wave 1. It is during this wave that we need to be cautious of a possible change in trend direction. In a lot of cases, wave 5 won’t move in an impulsive manner and have a flatter angle of ascent compared to wave 3

Knowing where you are within a trend is one of the most powerful tools for any trader, and understanding the geometry of market waves is critical to being able to do it.

Element 2: Implementing Pitchforks
The pitchfork (image below) is used to determine market direction and structure, almost as if we’re “mapping” the possible path of price in the future. This will, of course, helps us make winning trades.

We use the Wave element to know where we are within the trend so that we know which direction is a more profitable opportunity for us to trade. Now, by adding the Pitchfork to the appropriate pivot based on our wave forecast, we can identify potential price movement and can hone in on high-probability trade setups.

Element 3: Fibonacci
Fibonacci Retracements


Fibonacci Extensions
 Fibonacci Extensions are a way of projecting these ratios forward in time to find possible areas of support or resistance in the future. Price tends to react to these extensions when they eventually reach them, and they make good targets to trade toward when entering a position. We will also use them to measure corrections and for identifying wave characteristics.

Before we draw our extensions, we need a higher low followed by the break of a previous high. If we are of the opinion that price will continue higher, we would expect our Fibonacci ratios to act us resistance.

1. What is the trend doing?
2. Where are we within the trend cycle right now?
3. Where are viable entry points to enter during the next trend move?
4. Where are viable exit points to take my profit once it’s achieved?

When you know those 4 pieces of information, you are leaps and bounds ahead of the average trader. By studying market geometry and applying your own strategy to what you’ve learned in this free eBook, I’m confident that you will see vast improvement.

Rubber Band Reversal

Step 1  
Identify range bound markets on Daily or 4 Hour Charts 
A ranging market is simple to identify. We are looking for clearly defined sideways movement  that is sustained with several tops and bottoms.

Used a 20 and 50 EMA to show how moving averages can also  signal a ranging market as they quickly begin to flatten and intertwine with one another. This is,  of course, a lagging indicator but for those of you who like indicator confirmations, moving  averages are an easy way to confirm a ranging market. 

Step 2: 
Identify an Over Extension within a Dead Market 
More often than not, extended steep moves will pull back to settle toward reasonable prices, but  this is even more true when the market is in a defined range. When it begins to accelerate and  get overbought or oversold we are very likely to see it “snap back” like a rubber band once the it  runs out of orders to fulfill. 

As always, I like to use multiple time frames to get a complete, accurate view of the market, so  once we have a ranging 4 hour or Daily market condition, we’ll zoom into a 60 minute chart to  find an over­ extended point within the market.  

On the 60 minute chart, we’ll add a Bollinger Band (standard settings) and RSI (standard).  The Bollinger Bands and RSI give us a double confirmation to find over­extended conditions. 
Bollinger Bands are a great indicator for this because they shrink down and quickly define a range which, in turn, makes it obvious when the market is stretching out of that range. When you combine the defined ranges with stretched Bollinger Bands, you get a pretty good idea of when price might make a turn around. But we also like to use the RSI to make sure that price is clearly overbought or oversold. 
**Please Note: The RSI is NOT an entry signal. It simply helps our patience and discipline as  we are forced to confirm an overbought or oversold condition before going to the next step.  

The Bollinger Band and RSI are what allows us to be certain that the market has stretched like a Rubber Band and is ready for a potential snap back in the opposite direction. Now we know that the market is in position for our Rubber Band Reversal, but we do not have the ability to enter the trade yet. 

This is where a LOT of traders get tripped up. The see the RSI shoot over 65 or 70 and they are too trigger happy they just begin shorting the market. The problem is that more often than not, when the market hits 65 or 70 it is still in a momentum phase and we simply don’t know how long that momentum will last. We do not know how far the rubber band is going to stretch. We wait for the price to pierce the upper Bollinger band and simultaneously, we want RSI levels to be above 65 levels. After both conditions are met (Bollinger Band pierced and RSI overbought /oversold) we can go to Step 3. 

Step 3: Find an Entry  

To find a high probability entry, we look for a unique combination I have used for a long time. The combination is a 15 Minute Reversal Candlestick (pin bar, inside bar, engulfing, etc.) at a whole number. Whole numbers are important because of their psychological value. 

Step 4: Execution, Stop Loss and Take Profit 

Once the entry is made, we can place the Stop Loss a few ticks below the entry candle or previous candle (whichever has a higher high) and we can place our Take Profit at the mid­band 
of the Bollinger Bands.  

ஊசல் வணிகம் உத்தி - 04


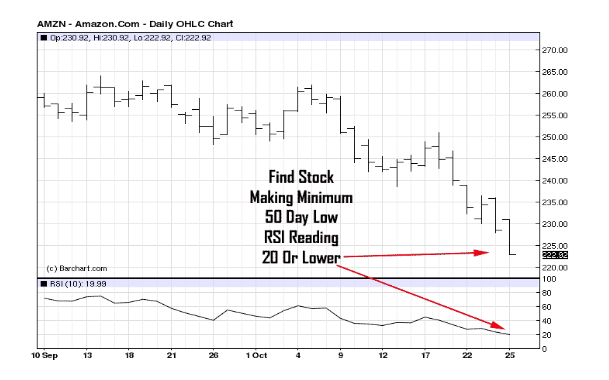
After adjusting the indicator from 14 periods to 10 periods, the next thing is to find stocks or other markets that are making a minimum 50 day low coupled with RSI reading 20 or lower. You can see what I mean by looking at this graph of Amazon stock.
The Longer the Trend Before Bottoming Out The Better
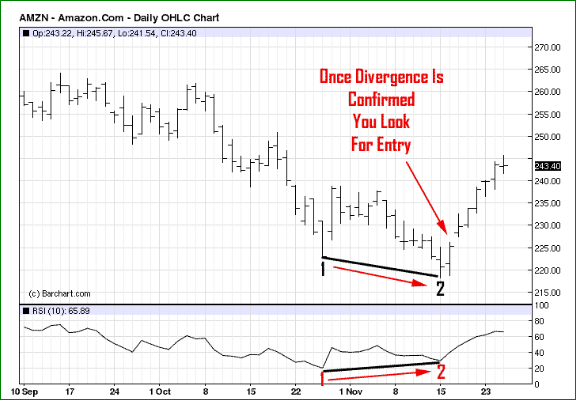
The next step, after you find both a stock making a minimum 50 day low; and RSI reading 20 or lower, is to continue to monitor it. You can give the stock up to a month to make the second low. The second price low must be below the first low but the RSI indicator must provide a higher signal than the first one. In this particular case, the first RSI signal was 20.00 even while the second RSI low bottomed out at 29.43.
The Second Price Low Must Be Lower and The Second RSI Low Must Be Higher.

How to Enter the Trade
Simply wait for the stock to trade above the high that was made on the second down day. Give the stock about 5 trading days and place a buy stop about 25 cents above the second bottom day. Remember if during this 5 day period the market trades below the low that was made on the second bottom day the trade is invalidated.  Unlike the moving average, the RSI is a leading indicator. These are swing trading indicators that project the future instead of relying on past price history.


If The Stock Trades Below the Second Low The Trade Is Invalid


Stock rallied almost immediately after making the second low. Make sure you place your buy stop one quarter or few ticks above the high that was made the day the second low was made. Always Use Stop Loss Orders When Trading Short Term Reversals.


The Distance Between Your Stop Loss Level And Entry Level Is About $7.50.. 

Assuming you successfully entered the trade, you must measure the distance between your entry price and your risk level. Once you do so you simply multiply this by four and add it to your entry price. This is your profit target and I recommend you follow the 1 to 4 risk level formula to assure a positive risk to reward level across your trades.

சனி, 9 நவம்பர், 2019

Quora விடைகள்

புதிய செய்திகள் உத்திகள் கிடைப்பதை பொருத்து இது அப்ப அப்ப இற்றைபடுத்தப்படும்
Is there any day trading strategy which has accuracy more than 80 percentage?

Here a Guerrilla strategy
It is just hit and run, the success ratio is more than 80.
Don’t look at risk reward ratio, just hit the trade and exit within few seconds..
If Previous Day is a Bull Candle - Open price Less than close.
  • Trading day = buy above yesterday’s high , the target is tricky,
  • Target = yesterday’s high + ( yesterday’s high - yesterday’s close) or
  • Target = yesterday’s high +0.5% - (whichever is smallest target)
If Previous Day is a Bear Candle - Open Price greater than close.
  • Trading day = sell below yesterday’s Low
  • Target = yesterday’s Low - ( yesterday’s close - yesterday’s low ) or
  • Target = yesterday’s low -0.5% ( whichever is smallest target)
The setup is invalid if the stock/index opens above the target or above yesterday’s high/low and touched the target.
I can take a scrip and give example for the above strategy, but I leave it readers do your homework, you can even come out a good different strategy out of this.
What two technical indicators have the highest success rate when used together for day trading?
the two that work best for me are:
  1. The Relative Strength Index - RSI.
  2. Bollinger bands.
Knowing how to use them and how not to use them is key

If you were to choose 4 stocks to regularly day trade, what would they be? Why?

MSFT, SPY, EEM, AAPL

What is pattern strategy you use?  I use Triangle.
d


ஞாயிறு, 3 நவம்பர், 2019

Value Investing Basics

PEG
Typically a stock with a PEG of less than 1 is considered undervalued (A value investor would typically seek a PEG of less than one.) since it's price is low compared to the company's expected earnings growth. A PEG greater than 1 might be considered overvalued since it might indicate the stock price is too high as compared to the company's expected earnings growth

P/B Book value.
The book value is derived from a company's assets and is a more conservative measure of a company's worth. A P/B ratio of 0.95, 1 or 1.1, the underlying stock is trading at nearly book value. In other words, the P/B ratio is more useful the greater the number differs from 1. To a value-seeking investor, a company that trades for a P/B ratio of 0.5 is attractive because it implies that the market value is one-half of the company's stated book value. 

P/E
P/E ratio shows what the market is willing to pay today for a stock based on its past or future earnings. A high P/E could mean that a stock's price is high relative to earnings and possibly overvalued. Conversely, a low P/E might indicate that the current stock price is low relative to earnings.

Free cash flow (FCF)
Free cash flow shows how efficient a company is at generating cash and is an important metric in determining whether a company has sufficient cash, after funding operations and capital expenditures, to reward shareholders  through  dividends and share buybacks

Free cash flow can be an early indicator to value investors that earnings may increase in the future, since increasing free cash flow typically precedes increased earnings. If a company has rising FCF, it could be due to revenue and sales growth, or cost reductions. In other words, rising free cash flows could the stock reward investors in the future which is why many investors cherish FCF as a measure of value. When a company's share price is low and free cash flow is on the rise, the odds are good that earnings and the value of the shares will soon be heading up.

Debt-to-equity ratio
The debt-to-equity ratio (D/E) helps investors determine how a company finances its assets. The ratio shows the proportion of equity to debt a company is using to finance its assets. 

A high debt-to-equity ratio doesn't necessarily mean the company is run poorly. Often, debt is used to expand operations and generate additional streams of income. Some industries, with a lot of fixed assets such as the auto and construction industries, typically have higher ratios than companies in other industries. 

Too much debt can pose a risk to a company if they don't have the earnings or cash flow to meet its debt obligations. 

Intrinsic Vale
Many methods are used to calculate Intrinsic value.
When figuring out a stock's intrinsic value, cash is king. Many models that calculate the fundamental value of a security factor in variables largely pertaining to cash: dividends and future cash flows, as well as utilize the time value of money. One model popularly used for finding a company's intrinsic value is the dividend discount model. The basic DDM is:
Where: Div = Dividends expected in one period, r = Required rate of return
Value of stock =  Expected dividend per share /  (Cost of capital Equity / Dividend growth rate )  as Value of stock = D / ( r - g )

DDM model
current share price of xyz is $25
want 12% return per year for xyz.
xyz pays dividend $3 per year, expected growth 4%/year

as per calculation (3/(.12-.04) = 37.50) it's value is 37.50 so now xyz  is undervalued.

https://www.investopedia.com/terms/d/ddm.asp

https://www.investopedia.com/articles/basics/12/intrinsic-value.asp?utm_source=value-investing&utm_campaign=www.investopedia.com&utm_term=&utm_medium=email


வியாழன், 31 அக்டோபர், 2019

நாள் வணிகம் இச்சேசன் பாண்ட் என்பவரின் உத்தி

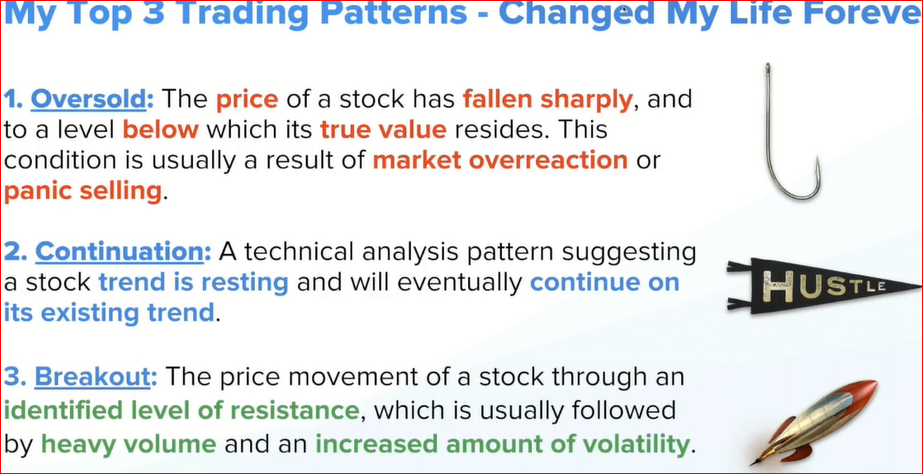
இச்சேசன் பாணடு என்பவரின் உத்தி இது விலை அதிகளவில் கீழே  இறங்கினால் அப்புறம் மேலே ஏறும் கொக்கி போல் அப்ப வாங்கி சிறிது ஏறினதும் விற்று விட வேண்டும்.

இவர் இவ்வுத்தியை Optionஇல் பயன்படுத்தி வரவு ஈட்டுகிறார்.


அவரின் புகழ்பெற்ற மூன்று ஒழுங்குகள்.

  1.  RSI என்பது 30இக்கும் கீழ் இருக்கவேண்டும், அப்படி இருந்தால் பங்கு அதிகளவில் விற்கப்பட்டுள்ளதை  குறிக்கும். 70இக்கும்  மேல் இருந்தால் அதிகம் வாங்கப்பட்டுள்ளதை குறிக்கும். அப்ப பங்கின் விலை மீன் கொக்கி போல் கீழ் வந்து மேல் எழும் நேரத்தில் பங்கை வாங்கி சிறிது நேரத்தில் விற்று விட    வேண்டும்.
  2. விலை உயர்ததும் போக்கு பக்கவாட்டில் சில நாள் சென்று பின் மீண்டும்  ஏறுமுக போக்கு தொடரும்.
  3. ஆதரவு-தடையில் தடையை விலை தொட்டதும் அதிக பங்கு கொள்ளளவு ஏற்பட்டு விலை மேலும் கீழும் மாறும் அது விலையில் பெரும் மாறுதல் ஏற்படும் என்பதன் அறிகுறி.


k

 கிட்ட தட்ட 50% முதல் இரு வாரங்களுக்குள் விற்ற பின் ஏதோ நல்ல செய்தி  வந்ததால் விலை ஏறுகிறது.  கவனிக்க  RSI - 30இக்கும் கீழ் போய் பின் மேலேறுகிறது. 


k


Use Call option if you thing prices go up then buy and sold
Use put option if you thing price will go down, put and sell.

IBD information to Buy to Sell etc

 எhttps://www.investors.com/how-to-invest/when-to-sell-stocks/   When to sell stocks. https://www.investors.com/how-to-invest/how-to-buy-sto...